
The 2026 Arizona Foreclosure Risk Index
Where financial pressure on Arizona homeowners is building, county by county
 Published on July 18th, 2026, by John Carter | Founder, NestCash
Original NestCash research, free to read and cite. If you need to sell a house fast in Arizona, start here.

Abstract
Arizona foreclosure activity is rising off a historic low. Filings in the first half of 2026 ran 29 percent above the same period in 2025 and 77 percent above 2024, and for one month this spring the state carried the seventh-highest foreclosure rate in the country. To understand where that pressure is concentrated, we built the Arizona Foreclosure Risk Index, a county-level measure that combines market softness, mortgage cost burden, mortgage delinquency, and unemployment into a single score from 0 to 100. We found that the risk is not where most people would guess. Maricopa County, home to Phoenix and roughly six in ten Arizona homes, carries the lowest risk score in the state. The counties under the most strain are rural, border, and mountain markets that rarely appear in a housing headline. This report explains the index, ranks all fifteen counties, and separates two things that are easy to confuse: the risk carried by the average homeowner, and the raw volume of foreclosures a county produces.
We score each county from 0 to 100 by blending four public signals, each weighted by how directly it bears on a mortgaged homeowner: market softness (35 percent), mortgage cost burden (30 percent), 90-day mortgage delinquency (20 percent), and unemployment (15 percent). Each signal is min-max normalized within Arizona, so the score ranks counties against one another in the state, not against a national or absolute standard. A county grades Elevated at 50 or above, Moderate from 44 to 49.9, and Lower below 44. We rank all 15 of Arizona’s counties. The full weighting, the normalization, and the limits of the data are spelled out in the methodology section below.
Key findings
- Arizona foreclosures are climbing fast from a low base. First-half 2026 filings totaled 5,412, or one in every 590 housing units, up 29.1 percent year over year and 77.3 percent versus the first half of 2024 (ATTOM Data Solutions).
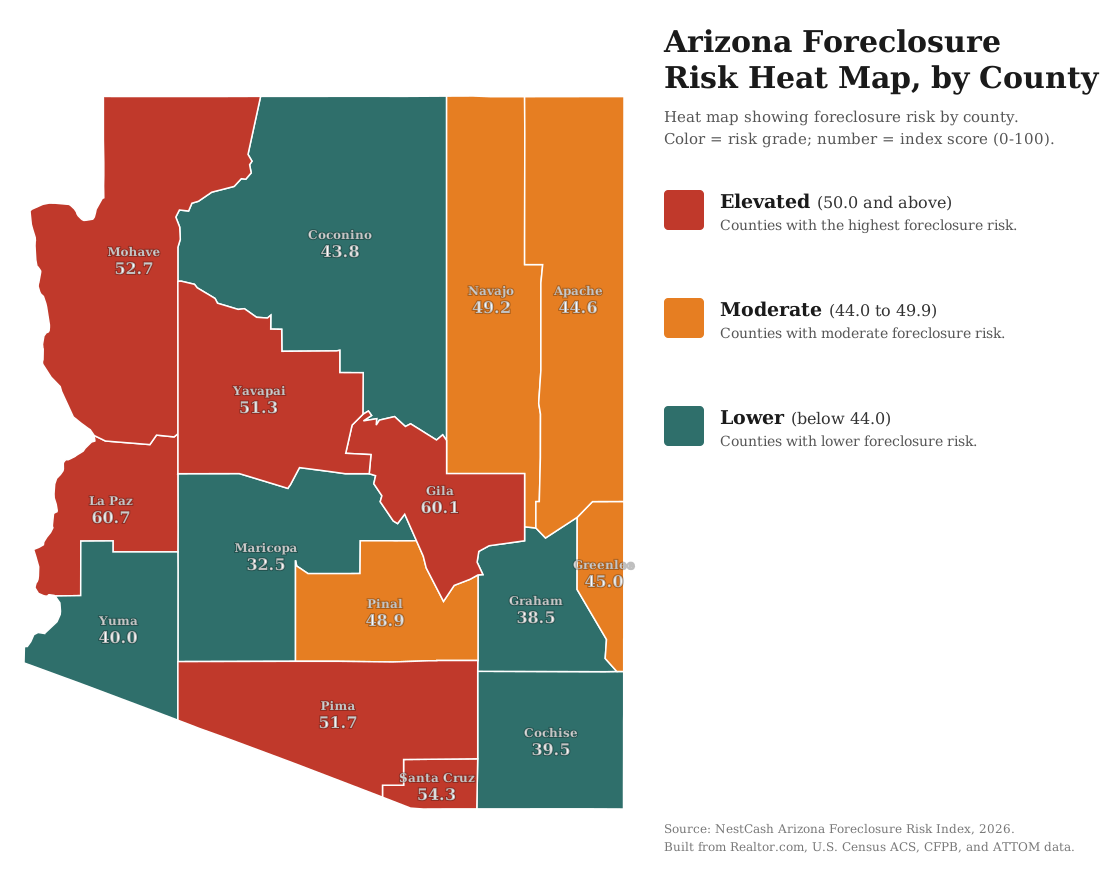
- The pressure is rural, not metropolitan. Six counties score in the Elevated tier of our index: La Paz (60.7), Gila (60.1), Santa Cruz (54.3), Mohave (52.7), Pima (51.7), and Yavapai (51.3). Maricopa, the largest county, scores lowest at 32.5.
- Housing cost burden follows the same pattern. In Gila County, 36.8 percent of homeowners with a mortgage spend more than 30 percent of their income on housing, against 25.2 percent in Maricopa (U.S. Census, American Community Survey).
- Delinquency is still low, but it is turning. Arizona’s serious mortgage delinquency rate (90 or more days past due) sat at 0.6 percent in September 2025, up from 0.4 percent in early 2024 (CFPB). Tucson and Pima County run slightly hotter than Phoenix and Maricopa.
- Volume and risk point in opposite directions. Maricopa carries the lowest risk per homeowner yet produces the most foreclosures in absolute terms, because it holds roughly 743,000 mortgaged homes to La Paz County’s 1,649.
Methodology
Data and sources
We built the index entirely from public and openly licensed data, and we cite each source at the point of use. Market conditions come from Realtor.com Economic Research (county listing data through June 2026). Housing tenure, mortgage status, cost burden, and county housing counts come from the U.S. Census Bureau’s American Community Survey five-year estimates. Mortgage delinquency comes from the Consumer Financial Protection Bureau’s Mortgage Performance Trends (latest data September 2025). Statewide and metropolitan foreclosure trends come from ATTOM Data Solutions’ published foreclosure market reports. Every dataset we used is free and publicly available, and every figure in this report traces back to one of the sources above.
Building the index
The Arizona Foreclosure Risk Index uses the same formula as every state in this series, a weighted blend of four signals, each chosen because it precedes or predicts foreclosure among homeowners who carry a mortgage:
35%
The share of active listings with a price cut and the median days a home sits on the market. A soft market matters because a homeowner in trouble who cannot sell quickly has fewer ways to avoid foreclosure.
30%
The share of owners with a mortgage who spend more than 30 percent of household income on housing. This is direct payment stress on the exact population that can be foreclosed on.
20%
The 90-day-or-more delinquency rate, the clearest early warning that foreclosures are coming.
15%
A secondary driver. We hold its weight down deliberately, because unemployment also captures renters and therefore dilutes a signal meant to describe homeowners.
We normalized each signal across the fifteen counties on a 0-to-1 scale, where 0 is the lowest value in Arizona and 1 is the highest, then applied the weights above and multiplied by 100. The result is a relative score: it ranks counties against one another within Arizona, not against a national or absolute standard. We then graded each county by its score, Elevated for a score of 50 or above, Moderate for 44 to 49.9, and Lower for anything below 44. Six counties land in the Elevated tier, four in Moderate, and five in Lower.
Limitations
Three limits are worth stating plainly. First, the index is relative. A Lower grade means lower risk than other Arizona counties, not low risk in absolute terms. Second, the CFPB reports county delinquency only where a county has at least 1,000 mortgages, so for the state’s smaller counties we substituted Arizona’s statewide delinquency rate. Because that component carries only 20 percent of the weight and Arizona’s delinquency rate varies little across the state, the substitution has a small effect on the rankings. Third, the index measures leading pressure, not completed foreclosures. Where our scores and realized foreclosure rates disagree, we say so rather than force a match.
Findings
The index: pressure is rural, not metropolitan
Ranked from most to least risk, the index tells a story that runs against the usual assumption that housing distress lives in the big city.
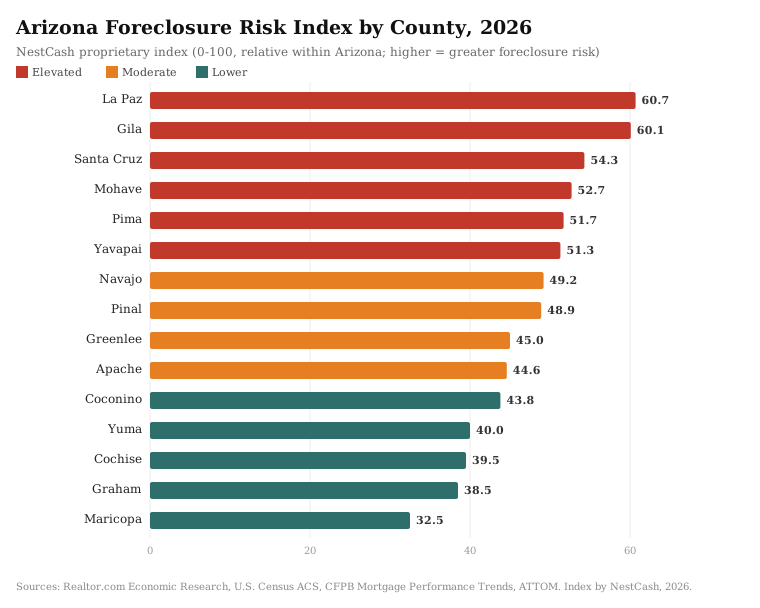
The six Elevated counties are La Paz, Gila, Santa Cruz, Mohave, Pima, and Yavapai. Most are small, and they share some mix of thin, slow-moving housing markets and stretched household budgets. La Paz tops the list at 60.7 on the strength of the longest median time on market in the state, 105 days, paired with double-digit unemployment. Gila follows at 60.1, driven by the highest mortgage cost burden anywhere in Arizona.
At the other end, Maricopa County scores 32.5, the lowest in the state. Phoenix has a soft-looking market on the surface, with nearly 29 percent of listings carrying a price cut, but its homeowners are, on balance, the least financially stretched in Arizona: unemployment of 4.6 percent, cost burden of 25.2 percent, and the state’s lowest serious delinquency rate at 0.5 percent.
The counties under the most pressure
La Paz (index 60.7, Elevated). A small county on the California border, La Paz posts the longest median time on market in Arizona at 105 days, roughly two-thirds longer than Maricopa. Its unemployment rate, 10.8 percent, is the highest in the state. Housing is inexpensive here, with a median value near 117,600 dollars, but a thin and slow market gives a struggling owner few exits. The county holds only 1,649 mortgaged homes, so the number of foreclosures it can generate is small even at elevated risk.
Gila (index 60.1, Elevated). Gila sits in the mountains east of Phoenix and carries the heaviest housing cost burden in Arizona. Of its homeowners with a mortgage, 36.8 percent spend more than 30 percent of income on housing and 16.8 percent spend more than half. When that large a share of owners is stretched that thin, a local job loss or a medical bill turns into a missed payment faster than it would in a wealthier county.
Santa Cruz (index 54.3, Elevated). A border county anchored by Nogales, Santa Cruz combines high cost burden (30.9 percent) with the second-highest unemployment in the state (10.5 percent) and a below-average median household income of 53,614 dollars. Its market is slow, with a median 82 days on market.
Mohave (index 52.7, Elevated). Mohave is the first of the Elevated counties that ATTOM also ranks among Arizona’s worst for realized foreclosure rate, which gives us more confidence in its placement. Nearly a third of its mortgaged owners are cost-burdened, and its market has softened, with a median 72 days on market and one in five listings carrying a price cut.
Pima (index 51.7, Elevated). Pima, home to Tucson, is the largest of the Elevated counties and the one where leading indicators and realized foreclosures align most cleanly. It is the only county besides Maricopa where we have county-level delinquency data, and at 0.7 percent serious delinquency it runs hotter than Phoenix. ATTOM also ranks it among the state’s worst foreclosure rates. Tucson is, in short, the large metro where Arizona’s rising foreclosure pressure is most visible today.
Yavapai (index 51.3, Elevated). Yavapai, which takes in Prescott and the retirement communities north of Phoenix, is the outlier of the group. Its unemployment is the second lowest in the state at 4.2 percent, yet its housing cost burden is the second highest at 34.8 percent. This is a market where work is steady but housing has grown expensive relative to local incomes, which leaves a large share of owners with thin margins and little room for a shock.
The anchor: Phoenix and Maricopa County
Maricopa deserves its own discussion because it anchors the state and confounds the simple story. It scores 32.5, the lowest risk in Arizona, yet it is the source of most of the state’s foreclosures. On the leading indicators, Phoenix homeowners look sound. Unemployment is 4.6 percent, well below the state’s stressed counties. Serious delinquency is 0.5 percent, the lowest in Arizona. Cost burden, at 25.2 percent, is the second lowest.
The one place Maricopa looks soft is the for-sale market, where 28.9 percent of listings carried a price cut in June 2026. That is a real signal, and it is why the county does not score even lower. But a price cut on a listing is a seller adjusting to a cooler market, which is a very different thing from a homeowner who cannot make a payment. The distinction is the whole point of separating market softness from delinquency and cost burden in the index.
Risk versus volume: the Phoenix paradox
The single most important thing to understand about this data is that risk per homeowner and total foreclosure volume are not the same measurement, and in Arizona they point in opposite directions.
Maricopa County ranks last on our risk index. It also produces, by a wide margin, the most foreclosures in the state. Both statements are true, and the reason is scale. Maricopa holds roughly 743,000 mortgaged homes. La Paz, the highest-risk county, holds 1,649. A low foreclosure rate applied to an enormous base still yields more foreclosures than a high rate applied to almost nothing. For a homeowner, the risk index is the relevant number. For anyone measuring the size of the market, volume is. We report both, and we caution against collapsing them into a single claim.
Leading indicators against realized filings
We tested our index against ATTOM’s published county foreclosure-rate rankings, which reflect actual filings rather than the leading signals we use. The two measures agree in part and diverge in part, and the divergence is itself informative. Two of the four counties ATTOM identifies with the highest foreclosure rates, Mohave and Pima, also land in our Elevated tier, and a third, Pinal, sits just below it. But Cochise, which ATTOM ranks among the worst, scores in our Lower tier, and our highest-scoring counties do not appear on ATTOM’s list at all.
We read this as the expected gap between pressure and outcome. Leading indicators describe strain that may or may not convert into filings, and local factors we do not capture, from a military base economy to a large share of homes owned free and clear, can pull realized foreclosures away from what the pressure alone would predict. A county where our index runs ahead of actual filings is a county where the risk has not yet landed. That is worth watching, not smoothing over.
What is driving the 2026 rise
Arizona’s increase is best understood as normalization layered on top of new strain, not a return to 2008. For the other states at the center of the last crisis, see our Nevada and Florida Foreclosure Risk Indexes.
The normalization is straightforward. Federal foreclosure moratoria and forbearance programs suppressed filings through 2020 and 2021, pushing Arizona’s numbers to artificial lows. As those protections ended, filings rebounded. Statewide filings jumped sharply in 2022 and have continued climbing since. What we are seeing in 2026 is partly the tail of that rebound.
The new strain is where the leading indicators earn their place. Serious delinquency has moved from 0.4 percent in early 2024 to 0.6 percent by late 2025, a small absolute change but a clear direction. Home prices remain high relative to incomes, which keeps cost burden elevated in exactly the counties our index flags. And mortgage rates that have stayed higher for longer have done two things at once: they have raised payments for anyone on an adjustable loan or a recent purchase, and they have made it harder for an owner in trouble to refinance out of the problem. An owner who in 2020 could have refinanced to a lower payment now often cannot, which removes an escape valve that used to keep filings down.
The rest-of-2026 outlook
We offer the following as a projection, not a forecast dressed up as certainty, and we show the method so it can be judged.
Arizona recorded 5,412 foreclosure filings in the first half of 2026. If the second half simply matches the first, the state finishes the year near 10,800 filings. Given that filings have accelerated through recent quarters rather than held flat, and that our leading indicators (rising delinquency, elevated cost burden, a softening resale market) all point the same direction, we treat that as a floor rather than a midpoint. A reasonable range for full-year 2026 is 10,800 to 12,000 filings, which would extend the streak of annual increases and keep Arizona above the national foreclosure rate.
Two things temper that. First, the base is still low by historical standards. National filings in 2025 remained 87 percent below the 2010 peak, and Arizona, while rising faster than the country, is rising off the same suppressed floor. Second, delinquency, the truest early signal, is climbing but remains under 1 percent. We expect continued increases in filings through the rest of 2026, not a spike. The story is a steady tightening, concentrated in the counties above, rather than a statewide emergency.
If you are an Arizona homeowner facing foreclosure
This report is a market analysis, not legal advice, but the data points to a few things worth knowing. Arizona is a non-judicial foreclosure state, which means a lender does not have to go through court to foreclose. The process runs on a Notice of Trustee’s Sale, and state law requires at least 90 days between that notice and the auction. That window is short, but it is enough to act in.
Owners in that window generally have more options than they realize: reinstating the loan by catching up on missed payments, negotiating a modification, or selling the home before the auction to pay off the balance and protect their credit. A sale ahead of the trustee’s sale is often the cleanest outcome, because a completed foreclosure stays on a credit report for seven years while a sale does not. NestCash works with Arizona homeowners in exactly this situation, in the Phoenix metro and in smaller markets like Casa Grande and Yuma. Our guide on how to sell a house in foreclosure walks through the timeline and the choices in more detail, and Phoenix owners can read our guide to avoiding foreclosure in Phoenix.
The full data
| Rank | County | Risk Index | Grade | Price-cut share | Median DOM | Cost burden | 90+ delinquency | Unemployment |
|---|---|---|---|---|---|---|---|---|
| 1 | La Paz | 60.7 | Elevated | 20.1% | 105 | 25.6% | 0.6%* | 10.8% |
| 2 | Gila | 60.1 | Elevated | 21.5% | 70 | 36.8% | 0.6%* | 7.4% |
| 3 | Santa Cruz | 54.3 | Elevated | 10.0% | 82 | 30.9% | 0.6%* | 10.5% |
| 4 | Mohave | 52.7 | Elevated | 20.0% | 72 | 32.3% | 0.6%* | 6.9% |
| 5 | Pima | 51.7 | Elevated | 22.0% | 62 | 26.7% | 0.7% | 5.7% |
| 6 | Yavapai | 51.3 | Elevated | 22.9% | 68 | 34.8% | 0.6%* | 4.2% |
| 7 | Navajo | 49.2 | Moderate | 25.1% | 70 | 24.4% | 0.6%* | 8.8% |
| 8 | Pinal | 48.9 | Moderate | 27.9% | 68 | 27.9% | 0.6%* | 5.8% |
| 9 | Greenlee | 45.0 | Moderate | 36.4% | 120 | 13.8% | 0.6%* | 3.5% |
| 10 | Apache | 44.6 | Moderate | 18.6% | 70 | 22.3% | 0.6%* | 10.0% |
| 11 | Coconino | 43.8 | Lower | 20.7% | 60 | 28.0% | 0.6%* | 6.6% |
| 12 | Yuma | 40.0 | Lower | 14.3% | 53 | 27.4% | 0.6%* | 8.1% |
| 13 | Cochise | 39.5 | Lower | 17.1% | 67 | 24.0% | 0.6%* | 7.3% |
| 14 | Graham | 38.5 | Lower | 18.9% | 59 | 25.5% | 0.6%* | 6.3% |
| 15 | Maricopa | 32.5 | Lower | 28.9% | 64 | 25.2% | 0.5% | 4.6% |
*County-level delinquency was unavailable, so the Arizona statewide rate is used. See Methodology.
What we will watch
We plan to update this index quarterly. The three things that will tell us whether Arizona’s tightening is turning into something larger are the serious delinquency rate, which is the earliest honest signal, whether the resale market keeps softening in the metros, and whether the counties where our index runs ahead of realized filings, La Paz and Gila in particular, begin to see those filings arrive. If they do, the pressure we are measuring will have converted into outcomes. If they do not, it will tell us the leading indicators overstated the risk in Arizona’s thinnest markets.
Sources and data
- Foreclosure activity and trend. ATTOM Data Solutions, 2026 Mid-Year U.S. Foreclosure Market Report and Foreclosure Rates by State. Used for statewide and metropolitan filing counts and rates.
- Housing market softness. Realtor.com Economic Research, county inventory core metrics through June 2026. Used for the price-cut share, median days on market, and active listing counts.
- Housing, mortgage status, and cost burden. U.S. Census Bureau, American Community Survey five-year estimates. Used for county housing counts, the mortgaged-owner universe, housing cost burden, and the denominators behind the rates.
- Mortgage delinquency. CFPB Mortgage Performance Trends, data through September 2025. Used for the 30-to-89 day and 90-or-more day delinquency rates.
About NestCash
NestCash buys houses for cash in twelve states, including throughout Arizona. We publish original housing research to help homeowners, buyers, and investors understand the markets we work in. This report may be cited and its charts embedded with attribution to NestCash.

John is the Founder of NestCash and a leading voice in real estate investing and housing market strategy. With experience across 12 states, he helps buyers, sellers, and investors make smarter decisions using real-world insight and market data.