
The 2026 Ohio Foreclosure Risk Index
Where financial pressure on Ohio homeowners is building, county by county
 Published on August 18th, 2026, by John Carter | Founder, NestCash
Original NestCash research, free to read and cite. If you need to sell a house fast in Ohio, start here.

Abstract
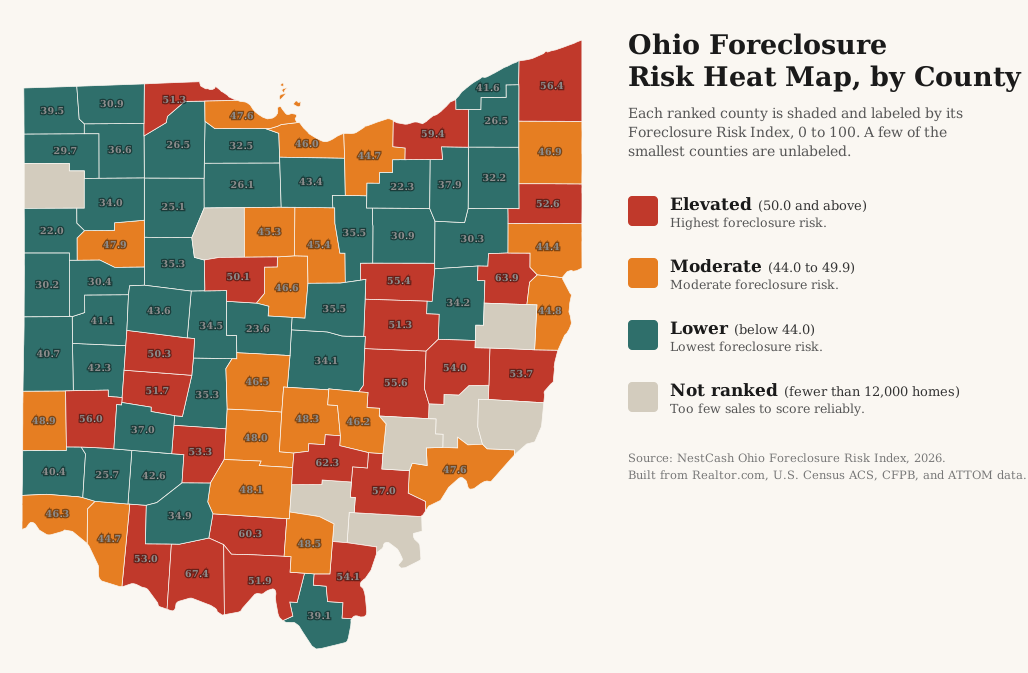
Ohio has the sort of foreclosure problem that shows up in the extreme cases. The two metros with the highest zombie-foreclosure rates in the entire country, homes abandoned by their owners while stuck in the foreclosure process, are both in Ohio: Youngstown and Cleveland. The state ranks eighth in the nation by foreclosure rate, with about 10,698 filings in the first half of 2026, one for every 495 housing units, up roughly 24 percent from a year earlier. But the state-level number hides a split that defines Ohio. To map it, we built the Ohio Foreclosure Risk Index, a county-level measure that scores counties from 0 to 100 by combining market softness, mortgage cost burden, mortgage delinquency, and unemployment. It finds two separate Ohios carrying the risk. One is the old industrial core, the Rust Belt cities of Cleveland, Dayton, Youngstown, and Toledo, where decades of manufacturing decline left behind aging housing and thin household finances. The other is the rural Appalachian southeast, the poor hill counties along the Ohio River, from Adams to Athens to Scioto. Between them sit the parts of Ohio that are doing well: the growth capital of Columbus, the Cincinnati metro, and the affluent suburbs of Delaware, Warren, and Medina, which are the safest ground in the state. Ohio’s foreclosure map is a map of who the modern economy left behind, and it points in two directions at once.
We score each county from 0 to 100 by blending four public signals, each weighted by how directly it bears on a mortgaged homeowner: market softness (35 percent), mortgage cost burden (30 percent), 90-day mortgage delinquency (20 percent), and unemployment (15 percent). Each signal is min-max normalized within Ohio, so the score ranks counties against one another in the state, not against a national or absolute standard. A county grades Elevated at 50 or above, Moderate from 44 to 49.9, and Lower below 44. One rule keeps the ranking honest: we rank the 80 counties with at least 12,000 housing units. Ohio has 88 counties, and a handful of the smallest, mostly in the Appalachian southeast, have too few home sales to score their market reliably. Those counties stay in the data but are not ranked, so a county with a few thousand homes never lands at the top of a statewide list on noise alone. The full weighting, the normalization, and the honest limits of the data are spelled out in the methodology section below.
Key findings
- Ohio is home to the nation’s two worst zombie-foreclosure metros. ATTOM ranks Youngstown (10.1 percent) and Cleveland (9.5 percent) first and second in the country for the share of foreclosures that are vacant, and Ohio second among all states for total zombie-foreclosure volume. Ohio ranks eighth nationally by overall foreclosure rate, one filing per 495 housing units.
- The old industrial cities carry the metropolitan risk. Cuyahoga County, home to Cleveland, grades Elevated at 59.4, and it is joined by Montgomery, home to Dayton (56.0), Mahoning, home to Youngstown (52.6), and Lucas, home to Toledo (51.3). These are the manufacturing centers that never fully recovered their industrial base.
- The Appalachian southeast carries the rural risk. The very top of the index is rural hill country: Adams County (67.4) leads the state, followed by Carroll (63.9), Hocking (62.3), Pike (60.3), and Athens (57.0). These are poor Ohio River and southeastern counties where low incomes meet high housing cost burden.
- Columbus and the affluent suburbs are the safest ground. Franklin County, home to the booming state capital, grades Moderate at 46.5, and Cincinnati’s Hamilton County (46.3) sits beside it. The lowest-risk counties in Ohio are the wealthy suburbs: Delaware County north of Columbus scores 23.6 with a delinquency rate of 0.2 percent, the lowest in the state, alongside Medina and Warren.
- Delinquency clusters in the industrial metros. Ohio’s statewide serious delinquency rate was 1.0 percent in December 2025 (CFPB). It runs highest in Toledo’s Lucas County at 1.5 percent and in Cleveland, Dayton, and Youngstown at 1.3 percent, and lowest in the Columbus and Cincinnati suburbs.
Methodology
Data and sources
We built the index entirely from public and openly licensed data, and we cite each source at the point of use. Market conditions come from Realtor.com Economic Research (county listing data through July 2026). Housing tenure, mortgage status, cost burden, county housing counts, and unemployment come from the U.S. Census Bureau’s American Community Survey five-year estimates. Mortgage delinquency comes from the Consumer Financial Protection Bureau’s Mortgage Performance Trends (latest data December 2025). Statewide filing counts, the national rank, the trend, and the zombie-foreclosure figures come from ATTOM Data Solutions’ published foreclosure and vacancy reports. Every dataset we used is free and publicly available.
Building the index
The Ohio Foreclosure Risk Index uses the same formula as every state in this series, a weighted blend of four signals, each chosen because it precedes or predicts foreclosure among homeowners who carry a mortgage:
35%
The share of active listings with a price cut and the median days a home sits on the market. A soft market matters because a homeowner in trouble who cannot sell quickly has fewer ways to avoid foreclosure.
30%
The share of owners with a mortgage who spend more than 30 percent of household income on housing. This is direct payment stress on the exact population that can be foreclosed on.
20%
The 90-day-or-more delinquency rate, the clearest early warning that foreclosures are coming.
15%
A secondary driver. We hold its weight down deliberately, because unemployment also captures renters and therefore dilutes a signal meant to describe homeowners.
We normalized each signal across the ranked counties on a 0-to-1 scale, where 0 is the lowest value in Ohio and 1 is the highest, then applied the weights above and multiplied by 100. The result is a relative score: it ranks counties against one another within Ohio, not against a national or absolute standard. We then graded each county by its score, Elevated for 50 or above, Moderate for 44 to 49.9, and Lower for anything below 44. Twenty-two counties land in the Elevated tier, twenty in Moderate, and thirty-eight in Lower.
Limitations
Four limits are worth stating plainly. First, we rank the 80 counties with at least 12,000 housing units, but that floor counts homes, not homes for sale. A few of the smallest ranked rural counties, Adams, Carroll, Pike, and Holmes among them, have very thin active-listing markets, fewer than a hundred homes listed at a time, so their market-softness component, 35 percent of the score, rests on a small sample and should be read as the least reliable input behind those specific rankings. Their cost-burden figures and the broader regional pattern are the robust signals. Second, the delinquency data is substituted for most rural counties. The CFPB reports county delinquency only where a county has enough mortgages to protect borrower privacy, so for 60 of the 80 ranked counties, including all four of the top-ranked southeastern counties, we substituted the Ohio statewide rate of 1.0 percent. This matters for how to read the map: the rural southeast ranks high on cost burden and a soft market, not on observed delinquency, while the observed delinquency evidence is strongest in the industrial metros, where Cuyahoga, Montgomery, Mahoning, and Lucas all report their own rates above the state average. Third, cost burden can mislead in a few atypical counties. Holmes County, the heart of Ohio’s Amish country, grades Elevated largely on a high cost burden, but it has the lowest unemployment of any Elevated county at 2.2 percent and a small, unusual mortgaged population in a largely cash-built local economy, so its rank reflects the arithmetic of the metric more than genuine distress. Fourth, the index measures leading pressure, not completed foreclosures. Where our scores and realized foreclosure activity disagree, we say so rather than force a match.
Findings
The index: two Ohios carrying the risk
Ranked from most to least risk, the index describes a state split three ways: a distressed rural southeast, a distressed industrial core, and a prospering middle that runs from Columbus to the suburbs.
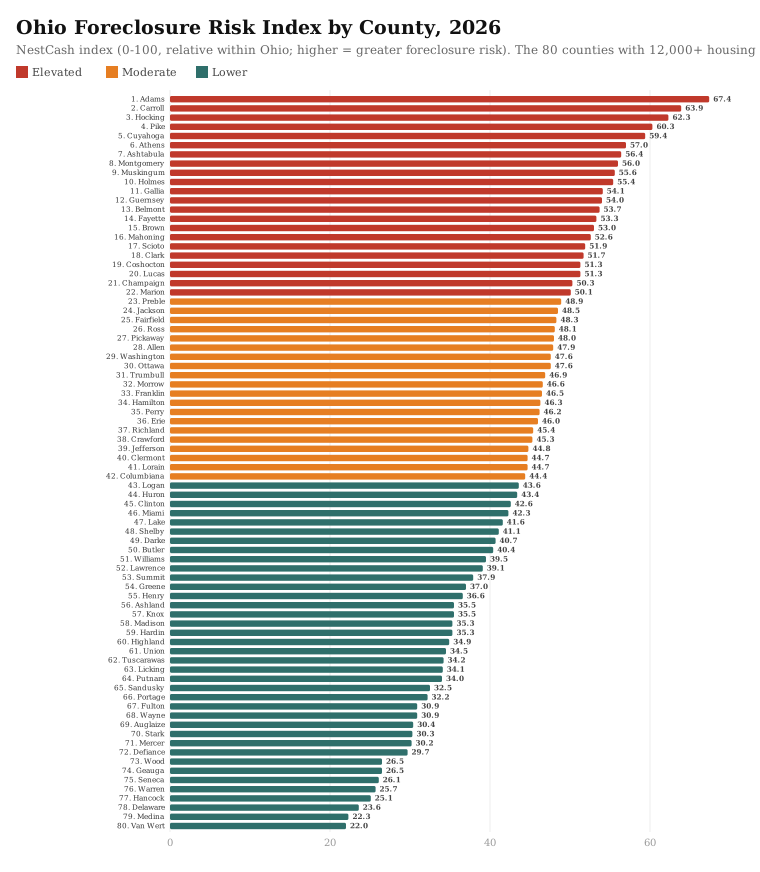
The top of the list is Appalachian Ohio, and it ranks there on affordability, not on observed foreclosure activity. Adams County, on the Ohio River in the state’s southern tip, leads at 67.4 chiefly because its mortgaged owners carry a heavy housing cost burden against low local incomes, paired with a slow rural market. Carroll (63.9), Hocking (62.3), Pike (60.3), and Athens (57.0), home to Ohio University, follow, all of them poor hill counties where incomes are low and the housing that exists is old and hard to sell. It is worth being precise about what drives these ranks. None of the top four southeastern counties reports its own delinquency rate, so their scores rest on cost burden and market softness rather than on measured payment stress, and in the smallest of them that market signal comes from only a few dozen active listings. Read them as the affordability squeeze in Ohio’s most economically distressed region, a real and long-standing condition, rather than as a wave of missed payments already underway.
Then, interleaved with them, come the big industrial metros. Cuyahoga County, home to Cleveland, sits fifth in the state at 59.4, a striking rank for a county of more than 600,000 housing units. It is joined by Montgomery, home to Dayton (56.0), Mahoning, home to Youngstown (52.6), and Lucas, home to Toledo (51.3). These four cities share a history: they built their prosperity on manufacturing, lost much of it over the last half century, and were left with aging housing stock, stretched household budgets, and, in Cleveland and Youngstown especially, some of the highest concentrations of vacant and abandoned foreclosures in the United States.
The zombie capital: Youngstown and Cleveland
The single most striking fact about foreclosure in Ohio is national. ATTOM’s vacancy data ranks Youngstown first and Cleveland second among all U.S. metros for their zombie-foreclosure rate, the share of homes in the foreclosure process that have been abandoned by their owners, at 10.1 and 9.5 percent. Ohio ranks second among all states for the raw number of zombie foreclosures. A zombie foreclosure is the worst-case version of the process: the owner has walked away, but the bank has not yet taken title, so the house sits empty, deteriorating, dragging down the block around it. That these homes cluster so heavily in Ohio’s old industrial cities is the clearest sign of what the index measures. Where our index reads highest among the metros, in Cuyahoga and Mahoning, is exactly where the abandoned houses are. It is also where the need to sell a distressed or vacant home before it reaches that point is most acute.
The prospering middle: Columbus and the suburbs
Between the two distressed Ohios sits the part of the state that is thriving. Franklin County, home to Columbus, the fastest-growing major metro in the state and the seat of a diversified government, university, and technology economy, grades only Moderate at 46.5. Cincinnati’s Hamilton County (46.3) is beside it. And the safest counties in all of Ohio are the affluent suburbs that ring these growth centers. Delaware County, the wealthy suburb north of Columbus, scores 23.6, the second lowest in the state, with a delinquency rate of just 0.2 percent. Medina, southwest of Cleveland, and Warren, between Cincinnati and Dayton, are close behind. The pattern is consistent: where the modern Ohio economy is concentrated, foreclosure risk is low. Where it is not, in the old factory towns and the rural hills, the risk is high.
Rate versus volume
Risk per homeowner and total foreclosure volume are different measurements, and Ohio shows both. Cuyahoga County is unusual because it scores high on both at once: it is one of the most Elevated metros in the index and, with more than 600,000 housing units, by far the largest county in the state, so it produces an enormous number of filings in raw terms. The rural Appalachian counties carry high risk per homeowner but small populations, so their raw counts stay modest. Columbus and Cincinnati produce large numbers of filings simply because they are large, even though their per-homeowner risk is middling. For a homeowner weighing their own exposure, the risk index is the relevant number. For anyone sizing the market, volume is, and in Ohio that volume concentrates in Cuyahoga County above all.
How today compares to the last crash
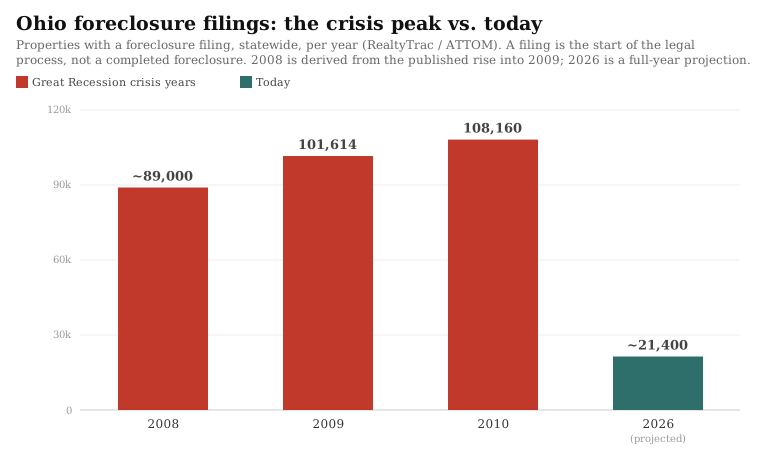
Ohio’s foreclosure story did not begin with the 2008 crisis. It began before it. As a Rust Belt state losing manufacturing jobs through the 2000s, Ohio was posting elevated foreclosure numbers years ahead of the national bubble, and when the crash came, it hit an already-weakened state hard. Ohio recorded about 101,614 properties with a foreclosure filing in 2009, the tenth-largest total in the country, and peaked at 108,160 in 2010. Today’s activity, a projected 21,000 or so filings for full-year 2026, runs roughly 80 percent below that peak.
But Ohio’s decline from the peak tells a different story than the Sun Belt’s. Florida and Arizona boomed and busted, so their foreclosure numbers spiked and then fell away sharply once the market cleared. Ohio never had that clean recovery, because it never had the boom. Its foreclosure pressure has eased in absolute terms but stayed stubbornly present, which is why the state still ranks eighth in the nation and still leads it in abandoned, zombie foreclosures. The crisis crested and receded; the underlying conditions in the industrial cities and the rural southeast did not.
If you are an Ohio homeowner facing foreclosure
This report is a market analysis, not legal advice, but the data points to a few things worth knowing. Ohio is a judicial foreclosure state, which means a lender must file a lawsuit and move the case through the Court of Common Pleas before a home can be sold at a sheriff’s sale. That court process takes time, often many months, and it gives an Ohio homeowner more room and more procedural rights than a fast, non-judicial state does. One point specific to Ohio is worth understanding: you hold a right of redemption, the right to pay off the debt and keep the home, up until the court confirms the sheriff’s sale. Once the sale is confirmed, that window closes. The practical takeaway is that the time to act runs through the court case and up to confirmation, not after.
Because the process moves through the courts rather than on a fixed fast timeline, using that time matters. Options like reinstatement, a loan modification, or selling the home before the sale can stop the process and limit the damage to your credit, since a foreclosure can remain on a credit report for up to seven years. NestCash works with Ohio homeowners in exactly this situation. Our guide on how to sell a house in foreclosure walks through the timeline and the choices in more detail, and you can also start with a cash offer anywhere in the state through our Ohio home-buying page.
The full data
The 80 ranked counties, from highest to lowest Foreclosure Risk Index. An asterisk on the delinquency rate marks a county where the Ohio statewide rate was substituted because the county’s own rate is not separately reported. See Methodology.
| Rank | County | Risk Index | Grade | Price-cut share | Median DOM | Cost burden | 90+ delinquency | Unemployment |
|---|---|---|---|---|---|---|---|---|
| 1 | Adams | 67.4 | Elevated | 17.2% | 50 | 29.6% | 1.0%* | 6.4% |
| 2 | Carroll | 63.9 | Elevated | 21.1% | 43 | 29.4% | 1.0%* | 5.6% |
| 3 | Hocking | 62.3 | Elevated | 23.5% | 66 | 22.2% | 1.0%* | 5.4% |
| 4 | Pike | 60.3 | Elevated | 20.4% | 56 | 24.7% | 1.0%* | 5.4% |
| 5 | Cuyahoga | 59.4 | Elevated | 18.3% | 41 | 24.4% | 1.3% | 6.6% |
| 6 | Athens | 57.0 | Elevated | 21.1% | 52 | 22.0% | 1.0%* | 6.5% |
| 7 | Ashtabula | 56.4 | Elevated | 16.0% | 46 | 24.8% | 1.0%* | 6.6% |
| 8 | Montgomery | 56.0 | Elevated | 26.6% | 38 | 21.9% | 1.3% | 5.7% |
| 9 | Muskingum | 55.6 | Elevated | 28.0% | 54 | 21.8% | 1.0%* | 4.3% |
| 10 | Holmes | 55.4 | Elevated | 11.1% | 50 | 31.9% | 1.0%* | 2.2% |
| 11 | Gallia | 54.1 | Elevated | 20.9% | 58 | 23.7% | 1.0%* | 3.5% |
| 12 | Guernsey | 54.0 | Elevated | 18.6% | 56 | 22.1% | 1.0%* | 5.3% |
| 13 | Belmont | 53.7 | Elevated | 21.0% | 57 | 20.7% | 1.0%* | 5.4% |
| 14 | Fayette | 53.3 | Elevated | 23.8% | 57 | 22.2% | 1.0%* | 3.7% |
| 15 | Brown | 53.0 | Elevated | 14.1% | 57 | 23.5% | 1.0%* | 4.9% |
| 16 | Mahoning | 52.6 | Elevated | 18.4% | 43 | 20.5% | 1.3% | 6.4% |
| 17 | Scioto | 51.9 | Elevated | 21.1% | 48 | 21.2% | 1.0%* | 5.9% |
| 18 | Clark | 51.7 | Elevated | 22.9% | 41 | 21.0% | 1.0%* | 6.7% |
| 19 | Coshocton | 51.3 | Elevated | 13.1% | 51 | 23.7% | 1.0%* | 5.4% |
| 20 | Lucas | 51.3 | Elevated | 12.2% | 39 | 21.5% | 1.5% | 6.3% |
| 21 | Champaign | 50.3 | Elevated | 30.9% | 35 | 22.0% | 1.0%* | 4.8% |
| 22 | Marion | 50.1 | Elevated | 26.2% | 41 | 19.6% | 1.0%* | 6.3% |
| 23 | Preble | 48.9 | Moderate | 20.6% | 52 | 23.0% | 1.0%* | 3.2% |
| 24 | Jackson | 48.5 | Moderate | 21.0% | 64 | 18.7% | 1.0%* | 3.8% |
| 25 | Fairfield | 48.3 | Moderate | 24.7% | 37 | 22.5% | 1.2% | 3.8% |
| 26 | Ross | 48.1 | Moderate | 21.8% | 40 | 24.3% | 1.0%* | 3.8% |
| 27 | Pickaway | 48.0 | Moderate | 22.1% | 44 | 23.6% | 1.0%* | 3.5% |
| 28 | Allen | 47.9 | Moderate | 19.5% | 54 | 18.4% | 1.0%* | 5.7% |
| 29 | Washington | 47.6 | Moderate | 19.9% | 51 | 20.3% | 1.0%* | 4.8% |
| 30 | Ottawa | 47.6 | Moderate | 19.2% | 57 | 21.7% | 1.0%* | 3.1% |
| 31 | Trumbull | 46.9 | Moderate | 24.7% | 40 | 20.4% | 1.1% | 4.7% |
| 32 | Morrow | 46.6 | Moderate | 26.4% | 47 | 21.5% | 1.0%* | 2.9% |
| 33 | Franklin | 46.5 | Moderate | 26.8% | 39 | 22.3% | 0.8% | 4.6% |
| 34 | Hamilton | 46.3 | Moderate | 21.3% | 40 | 22.4% | 0.9% | 5.0% |
| 35 | Perry | 46.2 | Moderate | 23.2% | 59 | 18.1% | 1.0%* | 3.7% |
| 36 | Erie | 46.0 | Moderate | 14.4% | 52 | 20.3% | 1.0%* | 5.3% |
| 37 | Richland | 45.4 | Moderate | 22.6% | 39 | 20.3% | 1.0%* | 5.4% |
| 38 | Crawford | 45.3 | Moderate | 20.7% | 48 | 19.7% | 1.0%* | 4.7% |
| 39 | Jefferson | 44.8 | Moderate | 22.6% | 50 | 17.8% | 1.0%* | 5.0% |
| 40 | Clermont | 44.7 | Moderate | 17.7% | 40 | 21.6% | 1.2% | 4.2% |
| 41 | Lorain | 44.7 | Moderate | 16.0% | 38 | 22.5% | 1.2% | 4.3% |
| 42 | Columbiana | 44.4 | Moderate | 17.4% | 44 | 21.7% | 1.0%* | 4.5% |
| 43 | Logan | 43.6 | Lower | 23.9% | 52 | 17.6% | 1.0%* | 4.1% |
| 44 | Huron | 43.4 | Lower | 20.6% | 41 | 20.8% | 1.0%* | 4.5% |
| 45 | Clinton | 42.6 | Lower | 19.2% | 48 | 19.1% | 1.0%* | 4.5% |
| 46 | Miami | 42.3 | Lower | 25.1% | 44 | 20.1% | 1.0%* | 3.1% |
| 47 | Lake | 41.6 | Lower | 21.6% | 33 | 20.0% | 1.3% | 3.9% |
| 48 | Shelby | 41.1 | Lower | 20.1% | 41 | 20.4% | 1.0%* | 4.1% |
| 49 | Darke | 40.7 | Lower | 36.0% | 36 | 18.0% | 1.0%* | 2.8% |
| 50 | Butler | 40.4 | Lower | 22.8% | 36 | 19.6% | 0.9% | 5.1% |
| 51 | Williams | 39.5 | Lower | 13.7% | 39 | 22.4% | 1.0%* | 4.0% |
| 52 | Lawrence | 39.1 | Lower | 15.6% | 46 | 21.8% | 1.0%* | 2.7% |
| 53 | Summit | 37.9 | Lower | 16.7% | 36 | 21.2% | 0.8% | 5.1% |
| 54 | Greene | 37.0 | Lower | 25.8% | 39 | 17.2% | 0.9% | 4.3% |
| 55 | Henry | 36.6 | Lower | 19.1% | 43 | 18.1% | 1.0%* | 3.9% |
| 56 | Ashland | 35.5 | Lower | 19.1% | 34 | 20.3% | 1.0%* | 3.6% |
| 57 | Knox | 35.5 | Lower | 24.2% | 44 | 17.7% | 1.0%* | 2.5% |
| 58 | Madison | 35.3 | Lower | 16.7% | 41 | 19.4% | 1.0%* | 3.5% |
| 59 | Hardin | 35.3 | Lower | 18.1% | 35 | 18.7% | 1.0%* | 4.6% |
| 60 | Highland | 34.9 | Lower | 19.1% | 46 | 17.7% | 1.0%* | 3.1% |
| 61 | Union | 34.5 | Lower | 25.3% | 45 | 16.4% | 1.0%* | 2.6% |
| 62 | Tuscarawas | 34.2 | Lower | 16.5% | 32 | 19.6% | 1.0%* | 4.5% |
| 63 | Licking | 34.1 | Lower | 23.3% | 39 | 19.9% | 0.7% | 3.2% |
| 64 | Putnam | 34.0 | Lower | 15.3% | 51 | 19.3% | 1.0%* | 1.8% |
| 65 | Sandusky | 32.5 | Lower | 13.3% | 34 | 19.6% | 1.0%* | 4.3% |
| 66 | Portage | 32.2 | Lower | 14.9% | 31 | 19.7% | 0.8% | 5.3% |
| 67 | Fulton | 30.9 | Lower | 9.5% | 41 | 18.9% | 1.0%* | 3.9% |
| 68 | Wayne | 30.9 | Lower | 16.1% | 29 | 20.6% | 1.0%* | 3.3% |
| 69 | Auglaize | 30.4 | Lower | 20.9% | 42 | 16.3% | 1.0%* | 2.7% |
| 70 | Stark | 30.3 | Lower | 13.0% | 35 | 18.9% | 1.0% | 3.9% |
| 71 | Mercer | 30.2 | Lower | 11.6% | 53 | 18.4% | 1.0%* | 1.6% |
| 72 | Defiance | 29.7 | Lower | 13.3% | 35 | 16.4% | 1.0%* | 5.2% |
| 73 | Wood | 26.5 | Lower | 8.9% | 37 | 16.8% | 1.0%* | 4.5% |
| 74 | Geauga | 26.5 | Lower | 12.0% | 33 | 19.1% | 1.0%* | 3.0% |
| 75 | Seneca | 26.1 | Lower | 16.7% | 35 | 15.8% | 1.0%* | 3.6% |
| 76 | Warren | 25.7 | Lower | 19.4% | 43 | 18.4% | 0.4% | 3.1% |
| 77 | Hancock | 25.1 | Lower | 12.2% | 37 | 17.1% | 1.0%* | 3.1% |
| 78 | Delaware | 23.6 | Lower | 24.2% | 39 | 18.4% | 0.2% | 3.0% |
| 79 | Medina | 22.3 | Lower | 16.5% | 36 | 18.0% | 0.6% | 2.9% |
| 80 | Van Wert | 22.0 | Lower | 10.8% | 31 | 17.0% | 1.0%* | 3.4% |
What we will watch
We plan to update this index quarterly. Three things will tell us where Ohio goes next: the delinquency rate in the industrial metros, which is where the zombie foreclosures concentrate and where the next wave would show first, whether the Appalachian southeast stabilizes or continues to hollow out, and whether the prosperity of the Columbus corridor keeps spreading outward or stays contained to the metro and its suburbs. Ohio ranks eighth in the nation today and holds the country’s worst concentration of abandoned foreclosures. The next few quarters will show whether the two distressed Ohios ease or deepen.
Sources and data
- Foreclosure activity, trend, and zombie rates. ATTOM Data Solutions, 2026 Mid-Year U.S. Foreclosure Market Report and its quarterly Vacant Property and Zombie Foreclosure reports. Used for statewide filing counts, the national rank, the year-over-year change, and the Youngstown and Cleveland zombie-foreclosure rankings. Historical year-end Ohio filing totals in the crisis comparison (101,614 in 2009 and 108,160 in 2010) come from RealtyTrac and ATTOM year-end reports; the 2008 figure is approximate and the 2026 figure is this report’s full-year projection.
- Housing market softness. Realtor.com Economic Research, county inventory core metrics through July 2026. Used for the price-cut share, median days on market, and active listing counts.
- Housing, mortgage status, cost burden, and unemployment. U.S. Census Bureau, American Community Survey five-year estimates. Used for county housing counts, the mortgaged-owner universe, housing cost burden, and the unemployment rate.
- Mortgage delinquency. CFPB Mortgage Performance Trends, data through December 2025. Used for the 90-or-more day delinquency rates.
About NestCash
NestCash buys houses for cash in twelve states, including throughout Ohio. We publish original housing research to help homeowners, buyers, and investors understand the markets we work in. This report may be cited and its charts embedded with attribution to NestCash.

John is the Founder of NestCash and a leading voice in real estate investing and housing market strategy. With experience across 12 states, he helps buyers, sellers, and investors make smarter decisions using real-world insight and market data.