

The Vacant & Abandoned Property Index
Where America’s vacant and abandoned homes are concentrated, county by county
 Published on July 28th, 2026, by John Carter | Founder, NestCash
Original NestCash research, free to read and cite. If you need to sell a vacant or abandoned property as-is, start here.
Abstract
Most housing vacancy is ordinary. A home sits empty between buyers, a condo waits for a renter, a cabin stands quiet until summer. None of that is abandonment. Buried inside the vacancy data is a smaller, harder category the Census Bureau calls “other vacant,” the homes that are empty for none of the usual reasons, not for sale, not for rent, not seasonal. These are the properties held off the market entirely, the houses working their way toward blight, tax delinquency, and the label neighbors use without hesitation: abandoned. There are about 5.2 million of them in the United States, roughly 3.6 percent of all housing. To find where they concentrate, we built the Vacant & Abandoned Property Index, a county-level measure that combines the other-vacant share with owner cost burden and the age of the housing stock into a single score from 0 to 100. The map it produces is not a map of the places Americans are moving to. It is a map of the places they left. The heaviest concentrations sit in the Deep South, across the Mississippi Delta and the old cotton and industrial counties of Alabama and Louisiana, in Appalachia from West Virginia through eastern Kentucky, and in a handful of legacy cities, New Orleans, Baltimore, and Danville, Virginia among them, where whole blocks emptied as the jobs did. The fast-growing Sun Belt, Utah, Arizona, and Colorado, sits at the bottom. Abandonment is a lagging indicator of decline, not a leading one of growth.
The word “vacant” hides a crucial distinction. The Census Bureau splits empty homes into categories, and most of them are normal: for sale, for rent, and seasonal or recreational (the vacation homes). We deliberately exclude all of those. Our index is built on the category the Bureau calls “other vacant”, the homes that are empty for none of those reasons, sitting off the market with no listing and no seasonal use. That bucket is the closest public proxy for genuinely abandoned and held-off-market housing. We score every county from 0 to 100 by blending three public signals: the other-vacant share (55 percent), owner cost burden (25 percent), and pre-1960 housing stock (20 percent). A county grades Elevated at 50 or above, Moderate from 33 to 49.9, and Lower below 33. The full weighting, the normalization, and the honest limits of the data are spelled out in the methodology below.
Key findings
- America holds about 5.2 million held-off-market vacant homes. That is 3.6 percent of all housing, and it is a distinct thing from normal for-sale or seasonal vacancy, which we exclude. These are the homes with no listing, no renter, and no seasonal use, the population that feeds blight and abandonment.
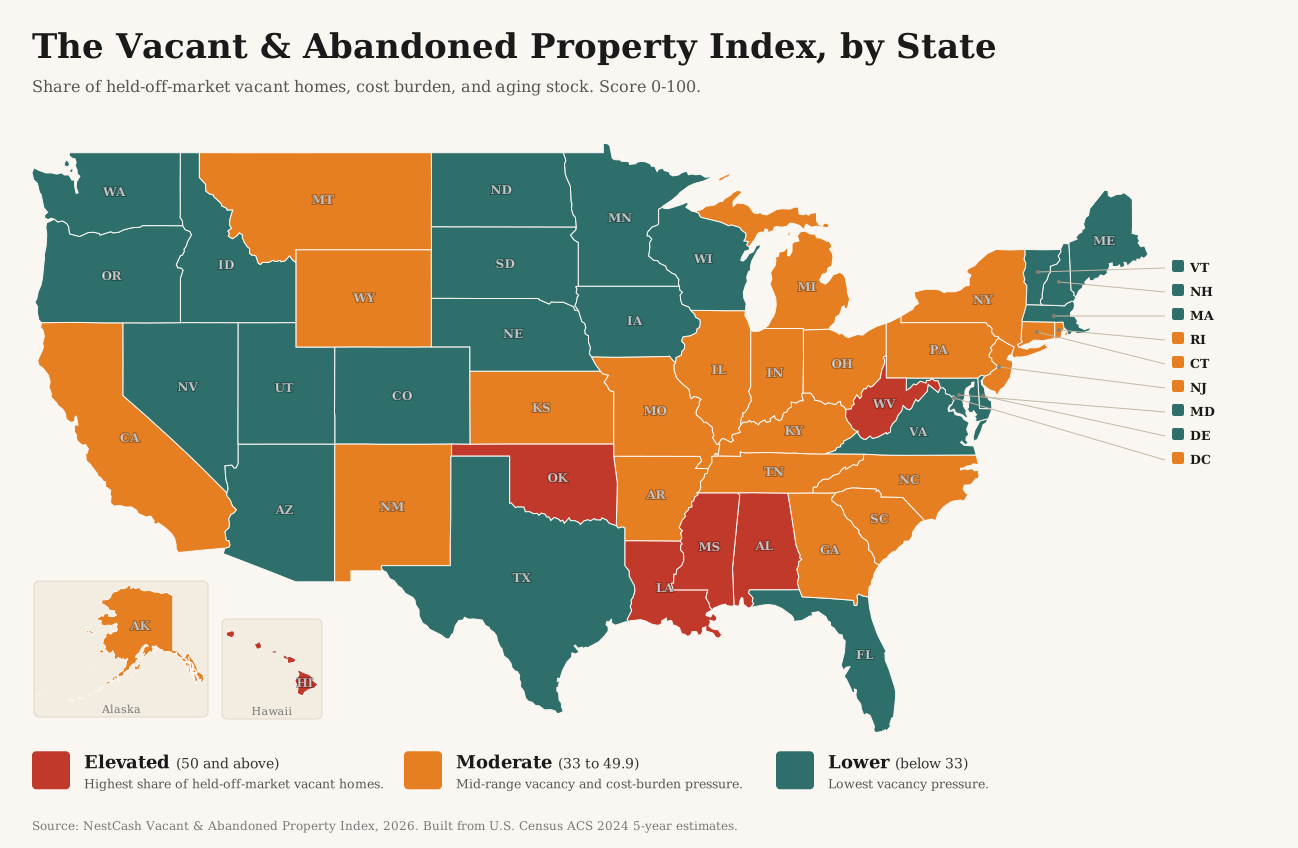
- The abandonment belt runs through the Deep South and Appalachia. Mississippi (state index 72.6), Louisiana (69.0), West Virginia (66.4), Alabama (59.4), and Oklahoma (54.0) lead every state. These are places shaped by population loss, aging housing, and stretched incomes, not by the housing booms of the last decade.
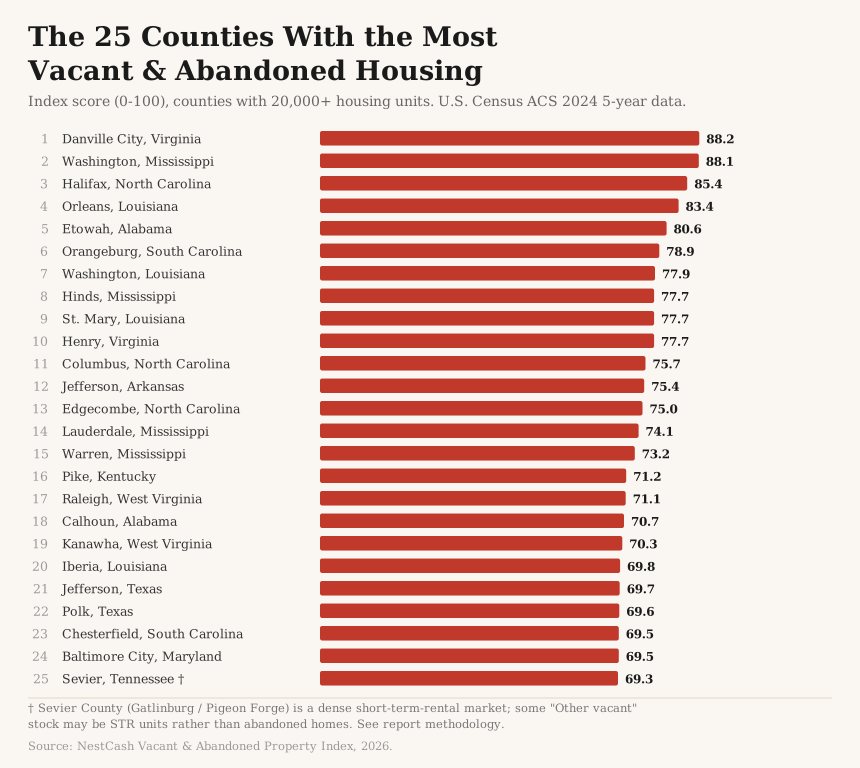
- The hardest-hit counties are small industrial and Delta counties, plus a few legacy cities. Danville, Virginia (index 88.2), an old tobacco and textile hub, tops all 1,129 ranked counties. Washington County, Mississippi (88.1) in the Delta, Halifax County, North Carolina (85.4), and Orleans Parish, Louisiana (83.4), home to New Orleans, follow.
- Independent data agrees. ATTOM’s Q2 2026 report names Oklahoma, Kansas, Alabama, West Virginia, and Missouri as the highest-vacancy states, and our index surfaces Alabama and West Virginia in the same top tier from a completely different method. ATTOM’s single highest zombie-foreclosure ZIP code in the country sits in Baltimore, and Baltimore is 24th on our county list.
- The growth states are the calmest. Utah (12.2), Arizona (15.7), Minnesota (17.0), and Colorado (18.6) score lowest. Young housing stock and steady in-migration leave very little sitting abandoned, whatever other affordability pressures those markets carry.
Methodology
Data and sources
We built the index entirely from free, public data, and we cite each source at the point of use. Vacancy composition, housing counts, owner cost burden, and housing age all come from the U.S. Census Bureau’s American Community Survey 2024 five-year estimates, pulled for every county in the country. We cross-checked our results against ATTOM Data Solutions’ publicly reported Q2 2026 vacancy and zombie-foreclosure figures and against published municipal blight counts, such as Baltimore’s. We did not use HUD’s USPS address-vacancy data, which is licensed only to government and non-profit users. Every figure in this report traces back to a public source.
Building the index
The index is a weighted blend of three signals, each chosen because it bears directly on whether a home ends up abandoned:
55%
The share of a county’s homes that are vacant for none of the ordinary reasons, not for sale, not for rent, not seasonal. This is the core signal, the Census category that most closely tracks genuinely abandoned housing.
25%
The share of owners with a mortgage who spend more than 30 percent of household income on housing. Payment stress is what turns a home an owner cannot afford into a home an owner walks away from.
20%
The share of homes built before 1960. Older stock is more expensive to maintain and quicker to fall past the point of repair, so aging housing and abandonment travel together.
Elevated is 50 or above, Moderate is 33 to 49.9, and Lower is below 33. The score is national and relative: it ranks each county against the others, not against an absolute standard.
We normalized each signal across counties on a 0-to-1 scale, then applied the weights above and multiplied by 100. To keep a single tiny county from setting the top of the national scale, we bounded the normalization at the 1st and 99th percentiles of the ranking-eligible set rather than the raw minimum and maximum. Rankings are limited to counties with at least 20,000 housing units, which removes small-sample noise and the wide margins of error that Census estimates carry in very small counties. That leaves 1,129 counties eligible to be ranked, of which 157 grade Elevated. Every county, including smaller ones, still appears in the state-level totals.
Limitations
Five limits are worth stating plainly. First, “other vacant” is a proxy for abandonment, not a parcel-by-parcel count of derelict homes, and the Census category will always include some units in transition. Second, the American Community Survey reports five-year rolling estimates, so the figures smooth conditions across 2020 through 2024 rather than capture a single moment. Third, in a few dense short-term-rental markets, some rental stock may be recorded as “other vacant” rather than seasonal. We flag those counties, and the clearest case is Sevier County, Tennessee, home to Gatlinburg and Pigeon Forge, where thousands of permitted short-term rentals sit alongside a high other-vacant count. Fourth, on tribal trust land the same category does not describe market abandonment at all, because that housing falls under tribal and federal jurisdiction and is not freely sold. Four Elevated counties (McKinley and San Juan in New Mexico, Apache in Arizona, and Robeson in North Carolina) are majority or plurality Native American, and we exclude them from the abandonment narrative and rankings discussion even though they remain in the data for transparency. Fifth, the index is relative: a Lower grade means less abandonment than other counties, not none.
Findings
A map of the places America left, not the places it is moving to
Ranked from most to least, the index tells a consistent story. The homes that sit abandoned are concentrated where population has drained, industry has gone, and the housing that remains is old and hard to afford. Nothing about the pattern tracks the last decade’s growth.
At the state level, Mississippi leads the country with an index of 72.6, followed by Louisiana (69.0), West Virginia (66.4), Alabama (59.4), and Oklahoma (54.0). This is the abandonment belt: the Deep South and Appalachia, where a century of outmigration and industrial loss has left more empty, off-market housing per home than anywhere else. At the other end sit the growth states. Utah scores 12.2, the lowest in the country, with Arizona (15.7), Minnesota (17.0), and Colorado (18.6) close behind. Young housing and steady in-migration keep almost nothing sitting abandoned, whatever else those markets struggle with on affordability.
One Elevated state sits apart from that Deep South and Appalachian pattern: Hawaii, sixth at 52.2. It gets there on cost, not vacancy. Hawaii carries the highest housing cost burden in the nation, and that one factor drives nearly half of its score, while its share of held-off-market vacant homes is unremarkable, 24th among the states. Because Hawaii is about as tourism and second-home heavy as any state, we checked whether that vacancy figure was inflated by short-term-rental stock the way a naive reading might fear. It is not, and the check is worth showing. In Hawaii’s tourism counties, Maui and Kauai, the seasonal-use share runs far ahead of the other-vacant share (13.2 versus 3.1 percent in Maui, 13.1 versus 7.3 percent in Kauai), which means the Census is placing that vacation housing in the seasonal category we exclude, exactly as the method intends. That is the mirror image of a genuinely short-term-rental-distorted county like Sevier, Tennessee, where the other-vacant share runs ahead of the seasonal one. Both Hawaii counties already carry our short-term-rental caveat flag. Hawaii is Elevated because its homeowners are stretched, not because the islands are full of abandoned houses.
The counties under the most pressure
The county rankings sharpen the picture. The top of the list is small industrial and Delta counties, punctuated by a few large legacy cities.
Danville, Virginia (index 88.2, Elevated). An independent city on the North Carolina line, Danville was built on tobacco and textiles and lost both. Nearly 11 percent of its homes are other-vacant and more than a third of its mortgaged owners are cost-burdened, the combination that puts it first of all 1,129 ranked counties.
Washington County, Mississippi (index 88.1, Elevated). Greenville and the surrounding Delta carry the highest other-vacant share of any sizable county in the country at 15 percent. The Delta’s long population decline is written directly into its empty housing.
Orleans Parish, Louisiana (index 83.4, Elevated). New Orleans has one of the most studied blight problems in America, and the data bears it out: nearly 11 percent of its roughly 196,000 homes are other-vacant, against the heaviest cost burden of any county in the top ten at 40 percent.
Baltimore, Maryland (index 69.5, Elevated). The national archetype of urban abandonment. The city’s own housing department counts roughly 11,558 vacant houses, down from a longtime range of 15,000 to 16,000, and ATTOM’s Q2 2026 report puts Baltimore’s 21217 ZIP code first in the nation for zombie foreclosures. Our index ranks the city 24th. Three independent measures, one conclusion.
The Appalachian cluster (Pike, Kentucky 71.2; Raleigh 71.1 and Kanawha 70.3, West Virginia). Coal country carries a distinct version of the pattern: high other-vacant shares paired with old housing stock and shrinking populations, the residue of an industry that no longer employs the towns it built.
Rate versus volume
Two very different measurements hide inside a ranking like this, and confusing them is the most common way to misread vacancy data. A small Delta county can post a 15 percent other-vacant share on twenty-thousand homes, while a large city posts a lower share on a far bigger base and still holds many more empty houses in raw terms. Orleans Parish and Baltimore rank high on both counts, which is why they draw headlines, but most of the top-ranked counties are small places with high rates and modest totals. Our 20,000-home floor keeps the very smallest counties, where a handful of homes can swing a percentage wildly, out of the rankings entirely. For a homeowner gauging their own market, the rate is the relevant figure. For anyone sizing the scale of abandonment, the raw count is. We report both and caution against collapsing them into one claim.
Leading indicators against realized activity
The index is built from housing composition, not foreclosure filings, so it is worth asking whether it agrees with data collected a different way. It does. ATTOM’s Q2 2026 vacancy report, which measures vacancy among homes already in the foreclosure process, names Oklahoma, Kansas, Alabama, West Virginia, and Missouri as the highest-vacancy states. Our index, built from Census vacancy composition with no foreclosure data at all, independently places Alabama and West Virginia in its top tier. And the single sharpest data point lines up exactly: ATTOM’s highest zombie-foreclosure ZIP code in the entire country is 21217 in Baltimore, the same city our county index flags 24th nationally. When two methods that share no inputs point at the same places, both gain credibility.
The full data, by state
Every state and the District of Columbia, ranked by index score. The held-off-market figure is the count of other-vacant homes. States where NestCash operates link to our local guides.
| Rank | State | Vacancy Index | Grade | Other-vacant share | Held-off-market homes |
|---|---|---|---|---|---|
| 1 | Mississippi | 72.6 | Elevated | 9.13% | 122,392 |
| 2 | Louisiana | 69.0 | Elevated | 8.12% | 171,214 |
| 3 | West Virginia | 66.4 | Elevated | 8.86% | 76,274 |
| 4 | Alabama | 59.4 | Elevated | 7.66% | 178,976 |
| 5 | Oklahoma | 54.0 | Elevated | 6.5% | 115,352 |
| 6 | Hawaii | 52.2 | Elevated | 3.72% | 21,118 |
| 7 | New Mexico | 49.7 | Moderate | 5.63% | 53,922 |
| 8 | New York | 48.8 | Moderate | 3.4% | 291,618 |
| 9 | Arkansas | 46.0 | Moderate | 6.41% | 89,337 |
| 10 | Kentucky | 45.8 | Moderate | 5.94% | 120,132 |
| 11 | Missouri | 42.9 | Moderate | 5.38% | 151,910 |
| 12 | Alaska | 42.8 | Moderate | 5.54% | 18,211 |
| 13 | California | 42.2 | Moderate | 2.09% | 306,250 |
| 14 | Illinois | 41.0 | Moderate | 3.94% | 214,922 |
| 15 | Kansas | 40.4 | Moderate | 4.82% | 62,414 |
| 16 | Tennessee | 40.4 | Moderate | 5.03% | 158,068 |
| 17 | Rhode Island | 39.6 | Moderate | 3.09% | 15,028 |
| 18 | South Carolina | 39.5 | Moderate | 5.27% | 128,831 |
| 19 | Connecticut | 39.2 | Moderate | 2.72% | 41,942 |
| 20 | Ohio | 38.6 | Moderate | 4.35% | 230,091 |
| 21 | Michigan | 38.4 | Moderate | 3.72% | 171,861 |
| 22 | District of Columbia | 37.3 | Moderate | 3.48% | 12,580 |
| 23 | Pennsylvania | 37.2 | Moderate | 3.81% | 221,344 |
| 24 | New Jersey | 36.3 | Moderate | 1.95% | 73,821 |
| 25 | Wyoming | 36.3 | Moderate | 4.38% | 12,127 |
| 26 | Montana | 35.1 | Moderate | 3.62% | 19,130 |
| 27 | Georgia | 34.4 | Moderate | 4.59% | 208,492 |
| 28 | North Carolina | 33.9 | Moderate | 4.63% | 226,630 |
| 29 | Indiana | 33.8 | Moderate | 4.34% | 129,201 |
| 30 | South Dakota | 32.9 | Lower | 4.43% | 18,084 |
| 31 | Maryland | 32.6 | Lower | 3.01% | 77,094 |
| 32 | Florida | 32.3 | Lower | 2.78% | 284,985 |
| 33 | Virginia | 31.7 | Lower | 3.67% | 135,235 |
| 34 | Texas | 30.9 | Lower | 3.51% | 425,639 |
| 35 | North Dakota | 30.8 | Lower | 4.49% | 16,954 |
| 36 | Iowa | 29.9 | Lower | 4.0% | 57,474 |
| 37 | Massachusetts | 29.1 | Lower | 2.11% | 64,070 |
| 38 | Nebraska | 28.8 | Lower | 3.6% | 31,052 |
| 39 | Maine | 28.6 | Lower | 3.37% | 25,312 |
| 40 | Vermont | 27.1 | Lower | 3.07% | 10,398 |
| 41 | Oregon | 25.0 | Lower | 2.0% | 37,237 |
| 42 | Delaware | 23.0 | Lower | 2.41% | 11,190 |
| 43 | Washington | 22.5 | Lower | 1.99% | 65,644 |
| 44 | New Hampshire | 21.5 | Lower | 2.26% | 14,624 |
| 45 | Wisconsin | 21.1 | Lower | 2.37% | 65,796 |
| 46 | Nevada | 20.7 | Lower | 2.62% | 34,709 |
| 47 | Idaho | 19.0 | Lower | 2.31% | 18,333 |
| 48 | Colorado | 18.6 | Lower | 1.74% | 45,040 |
| 49 | Minnesota | 17.0 | Lower | 1.98% | 50,367 |
| 50 | Arizona | 15.7 | Lower | 2.17% | 69,349 |
| 51 | Utah | 12.2 | Lower | 1.78% | 21,741 |
The 25 counties under the most pressure
Ranking-eligible counties (20,000 or more housing units) with the highest index scores. The dagger marks a short-term-rental caveat, explained in the limitations above.
| Rank | County | State | Vacancy Index | Grade | Other-vacant share | Cost burden | Housing units |
|---|---|---|---|---|---|---|---|
| 1 | Danville City | Virginia | 88.2 | Elevated | 10.9% | 36.5% | 22,376 |
| 2 | Washington | Mississippi | 88.1 | Elevated | 15.0% | 32.5% | 20,867 |
| 3 | Halifax | North Carolina | 85.4 | Elevated | 13.0% | 35.8% | 24,872 |
| 4 | Orleans | Louisiana | 83.4 | Elevated | 10.7% | 40.0% | 195,552 |
| 5 | Etowah | Alabama | 80.6 | Elevated | 12.0% | 26.9% | 47,603 |
| 6 | Orangeburg | South Carolina | 78.9 | Elevated | 13.1% | 31.6% | 41,527 |
| 7 | Washington | Louisiana | 77.9 | Elevated | 12.7% | 29.9% | 21,439 |
| 8 | Hinds | Mississippi | 77.7 | Elevated | 10.9% | 28.7% | 106,340 |
| 9 | St. Mary | Louisiana | 77.7 | Elevated | 12.1% | 25.5% | 22,507 |
| 10 | Henry | Virginia | 77.7 | Elevated | 11.9% | 24.2% | 25,404 |
| 11 | Columbus | North Carolina | 75.7 | Elevated | 10.4% | 36.1% | 23,563 |
| 12 | Jefferson | Arkansas | 75.4 | Elevated | 16.3% | 24.9% | 30,679 |
| 13 | Edgecombe | North Carolina | 75.0 | Elevated | 11.0% | 31.2% | 23,281 |
| 14 | Lauderdale | Mississippi | 74.1 | Elevated | 10.9% | 29.4% | 33,551 |
| 15 | Warren | Mississippi | 73.2 | Elevated | 15.5% | 25.0% | 21,566 |
| 16 | Pike | Kentucky | 71.2 | Elevated | 13.1% | 26.5% | 29,044 |
| 17 | Raleigh | West Virginia | 71.1 | Elevated | 11.6% | 22.9% | 34,604 |
| 18 | Calhoun | Alabama | 70.7 | Elevated | 11.9% | 21.2% | 53,361 |
| 19 | Kanawha | West Virginia | 70.3 | Elevated | 10.7% | 19.6% | 90,408 |
| 20 | Iberia | Louisiana | 69.8 | Elevated | 10.5% | 28.1% | 31,344 |
| 21 | Jefferson | Texas | 69.7 | Elevated | 9.7% | 28.2% | 109,884 |
| 22 | Polk | Texas | 69.6 | Elevated | 11.9% | 29.0% | 26,469 |
| 23 | Chesterfield | South Carolina | 69.5 | Elevated | 11.6% | 24.8% | 20,843 |
| 24 | Baltimore City | Maryland | 69.5 | Elevated | 8.7% | 32.6% | 295,032 |
| 25 | Sevier † | Tennessee | 69.3 | Elevated | 13.2% | 28.2% | 58,967 |
† Sevier County (Gatlinburg and Pigeon Forge) is a dense short-term-rental market. Some of its “other vacant” stock may be short-term-rental units rather than abandoned homes. See the limitations above.
If you own a vacant or abandoned property
This report is a market analysis, not legal or tax advice, but the data points to a few things worth knowing. A vacant house is rarely a neutral asset. It carries property taxes, insurance that gets harder to keep as the home sits empty, code-enforcement exposure, and a maintenance bill that only grows. Many of these homes are inherited, left to heirs who live in another state and never planned to become landlords or renovators. Others belong to owners who moved on and could not sell. In almost every case the practical question is the same: how to move a property that a traditional buyer, who wants a move-in-ready home, will not touch.
That is what a cash, as-is sale is for. Selling a vacant or abandoned property as-is means no repairs, no staging, and no carrying the house through months on the market. If the home came to you through an estate, our guide to selling an inherited house walks through the probate timeline and the choices that come with it. NestCash buys houses in this exact condition, in the markets we serve, and closes on the seller’s schedule rather than a lender’s.
Sources and data
- Vacancy, housing, cost burden, and housing age. U.S. Census Bureau, American Community Survey 2024 five-year estimates. Used for the other-vacant share (the “other vacant” line of the vacancy-status table), total housing counts, owner cost burden, and pre-1960 housing stock, pulled for every U.S. county.
- Vacancy and zombie-foreclosure cross-check. ATTOM Data Solutions, Q2 2026 Vacant Property and Zombie Foreclosure Report. Used to validate our state and county results against an independently collected measure.
- Municipal blight counts. City of Baltimore Department of Housing and Community Development published vacant-building figures, used to corroborate the Baltimore finding.
We did not use HUD’s aggregated USPS address-vacancy data, which is available only to government and non-profit users under its license.
About NestCash
NestCash buys houses for cash in twelve states, including homes that are vacant, inherited, or in no condition for a traditional sale. We publish original housing research to help homeowners, buyers, and investors understand the markets we work in. This report may be cited and its charts embedded with attribution to NestCash.

John is the Founder of NestCash and a leading voice in real estate investing and housing market strategy. With experience across 12 states, he helps buyers, sellers, and investors make smarter decisions using real-world insight and market data.