
The 2026 South Carolina Foreclosure Risk Index
Where financial pressure on South Carolina homeowners is building, county by county
 Published on August 18th, 2026, by John Carter | Founder, NestCash
Original NestCash research, free to read and cite. If you need to sell a house fast in South Carolina, start here.

Abstract
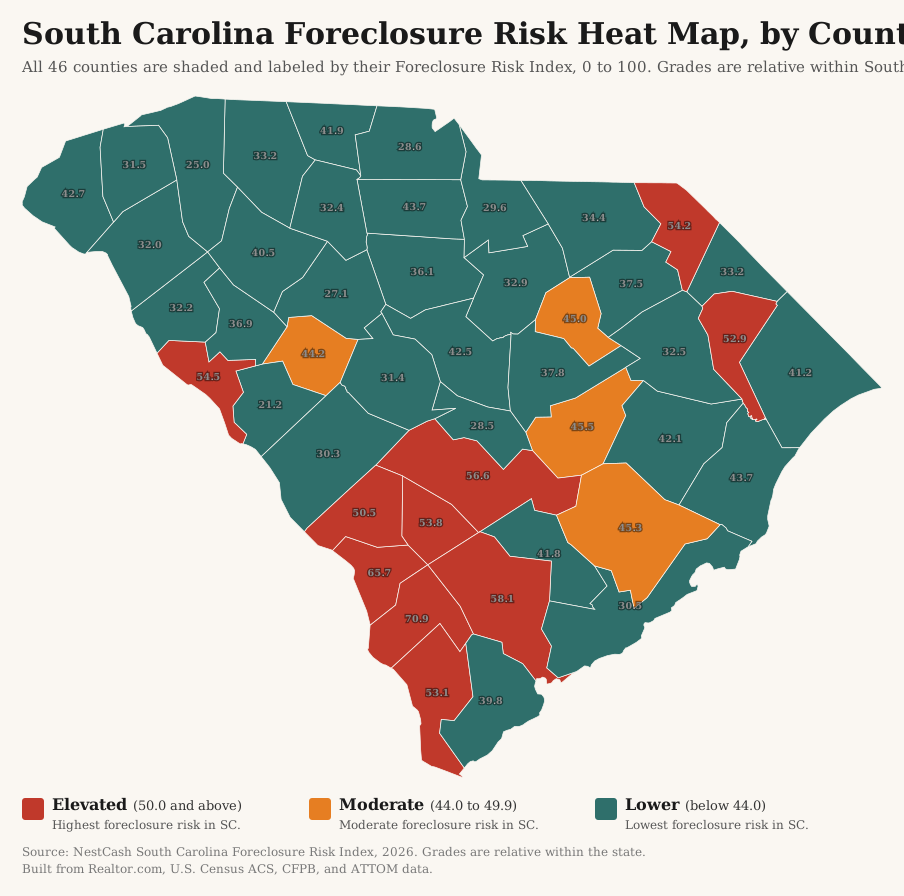
South Carolina has the second-highest foreclosure rate in the United States. In the first half of 2026 the state recorded about 6,419 foreclosure filings, one for every 381 housing units, a rate behind only Florida, and up roughly 32 percent from a year earlier. What makes South Carolina worth a close look is not that it climbed the list, but how quietly it did so. Unlike Florida, Arizona, or Georgia, South Carolina was never a household name in the last foreclosure crisis. It has arrived at second-worst in the nation without ever being the story, and the reason is a distress that hides in plain sight. It is not in the places the state is known for. To map it, we built the South Carolina Foreclosure Risk Index, a county-level measure that scores all 46 counties from 0 to 100 by combining market softness, mortgage cost burden, mortgage delinquency, and unemployment. It finds almost none of the risk in the booming coast and Upstate. Charleston, Greenville, Myrtle Beach, and Hilton Head, the engines of South Carolina’s growth, all grade among the lowest-risk counties in the state. The pressure sits instead in the rural interior, in the poor, economically left-behind counties strung along and inland from Interstate 95 and the Savannah River, the belt of Hampton, Allendale, Colleton, Orangeburg, and Bamberg. This is a report about a paradox: one of the worst foreclosure rates in America, concentrated in the parts of the state that growth left behind.
We score each of South Carolina’s 46 counties from 0 to 100 by blending four public signals, each weighted by how directly it bears on a mortgaged homeowner: market softness (35 percent), mortgage cost burden (30 percent), 90-day mortgage delinquency (20 percent), and unemployment (15 percent). Each signal is min-max normalized within South Carolina, so the score ranks counties against one another in the state. A county grades Elevated at 50 or above, Moderate from 44 to 49.9, and Lower below 44. One point matters more here than in most states: because South Carolina has the nation’s second-highest foreclosure rate, these grades are relative to one another, not to the country. A Lower grade means lower risk than other South Carolina counties, not low risk in absolute terms. Even the safest counties in this index sit in one of the two worst states in America. The full weighting, the normalization, and the honest limits of the data are spelled out in the methodology section below.
Key findings
- South Carolina has the nation’s second-highest foreclosure rate. First-half 2026 filings totaled about 6,419, one for every 381 housing units, second only to Florida (ATTOM Data Solutions), and up about 32 percent year over year. It reached that ranking without ever having been a marquee crisis state.
- The risk is rural, not metropolitan. Every one of South Carolina’s growth engines grades Lower. Greenville is the lowest-risk large county in the state, and Charleston, Columbia’s Richland County, Myrtle Beach’s Horry County, and Beaufort, home to Hilton Head, all sit in the Lower tier too.
- The rural Lowcountry carries the highest risk. Hampton County tops the index at 70.9, followed by Allendale (65.7), Colleton (58.1), Orangeburg (56.6), and McCormick (54.5). These are the poor, rural, majority-Black counties of the Lowcountry, the Savannah River corridor, and the Pee Dee, several of them the same places long known as South Carolina’s “Corridor of Shame” for their underfunded schools.
- The drivers are cost burden and jobs, not a housing bubble. The Elevated counties are stretched, not overbuilt. Hampton County’s mortgaged owners carry a 40.4 percent housing cost burden and Barnwell’s 38.2 percent, the heaviest in the state, while Bamberg County’s unemployment rate is 11.9 percent, the highest in South Carolina.
- Delinquency is broadly elevated. South Carolina’s statewide serious delinquency rate was 1.2 percent in December 2025 (CFPB), higher than most states we have studied, consistent with its national ranking. It runs highest in Berkeley County near Charleston at 2.1 percent.
Methodology
Data and sources
We built the index entirely from public and openly licensed data, and we cite each source at the point of use. Market conditions come from Realtor.com Economic Research (county listing data through July 2026). Housing tenure, mortgage status, cost burden, county housing counts, and unemployment come from the U.S. Census Bureau’s American Community Survey five-year estimates. Mortgage delinquency comes from the Consumer Financial Protection Bureau’s Mortgage Performance Trends (latest data December 2025). Statewide filing counts, the national rank, and trend come from ATTOM Data Solutions’ published foreclosure market reports. Every dataset we used is free and publicly available.
Building the index
The South Carolina Foreclosure Risk Index uses the same formula as every state in this series, a weighted blend of four signals, each chosen because it precedes or predicts foreclosure among homeowners who carry a mortgage:
35%
The share of active listings with a price cut and the median days a home sits on the market. A soft market matters because a homeowner in trouble who cannot sell quickly has fewer ways to avoid foreclosure.
30%
The share of owners with a mortgage who spend more than 30 percent of household income on housing. This is direct payment stress on the exact population that can be foreclosed on.
20%
The 90-day-or-more delinquency rate, the clearest early warning that foreclosures are coming.
15%
A secondary driver. We hold its weight down deliberately, because unemployment also captures renters and therefore dilutes a signal meant to describe homeowners.
We normalized each signal across the 46 counties on a 0-to-1 scale, where 0 is the lowest value in South Carolina and 1 is the highest, then applied the weights above and multiplied by 100. The result is a relative score: it ranks counties against one another within South Carolina, not against a national or absolute standard. We then graded each county by its score, Elevated for 50 or above, Moderate for 44 to 49.9, and Lower for anything below 44. Ten counties land in the Elevated tier, four in Moderate, and thirty-two in Lower.
Limitations
Three limits are worth stating plainly. First, and most important for this state, the index is relative. South Carolina has the nation’s second-highest foreclosure rate, so a Lower grade means a county carries less risk than other South Carolina counties, not that it is safe in absolute terms. The metros that grade Lower here would grade higher in a healthier state. Second, the delinquency data is substituted for most rural counties, which shapes how to read the rural story. The CFPB reports county delinquency only where a county has enough mortgages to protect borrower privacy, so for 34 of the 46 counties, including all ten of the Elevated counties, we substituted the South Carolina statewide rate of 1.2 percent. The rural Elevated ranks therefore rest on cost burden, unemployment, and a soft market, not on observed delinquency, which is reported only in the larger, mostly lower-risk counties. Read the rural tier as an affordability-and-jobs squeeze, anchored by robust Census figures like Hampton County’s 40.4 percent housing cost burden and Bamberg County’s 11.9 percent unemployment, rather than as a wave of missed payments already on the books. Third, we rank all 46 counties rather than applying a housing-unit floor, because South Carolina’s counties are relatively few and mostly of workable size. But that floor would count homes, not homes for sale: in the smallest counties the market-softness signal, 35 percent of the score, rests on a thin set of listings. Four counties in the Elevated tier had fewer than forty homes on the market in July 2026, Allendale with 16, Marlboro with 31, Barnwell with 35, and Bamberg with 37, so the market-softness component behind their specific ranks should be read with more caution. The cost-burden and unemployment signals that drive them are robust Census estimates.
Allendale needs the sharpest caveat of any county in this table, and we would rather state it than let a reader find it. Allendale ranks second in the index, and it has the thinnest market in South Carolina. Its median time on market of 128 days is the longest of any county in the state, and it is measured across just 16 active listings. A handful of unusual listings would move that number a long way. The two signals that carry 45 percent of Allendale’s score, a 32.9 percent mortgage cost burden and 10.8 percent unemployment, are robust Census estimates and are what put the county in the Elevated tier. Its market-softness component, 35 percent of the score, is the least stable figure in this report. Read Allendale’s specific rank accordingly.
Findings
The index: a rural crisis in a coastal boom state
Ranked from most to least risk, the index describes two South Carolinas. One is the coast and the Upstate, where people and money are moving in. The other is the rural interior they are moving away from, and that is where the foreclosures are.
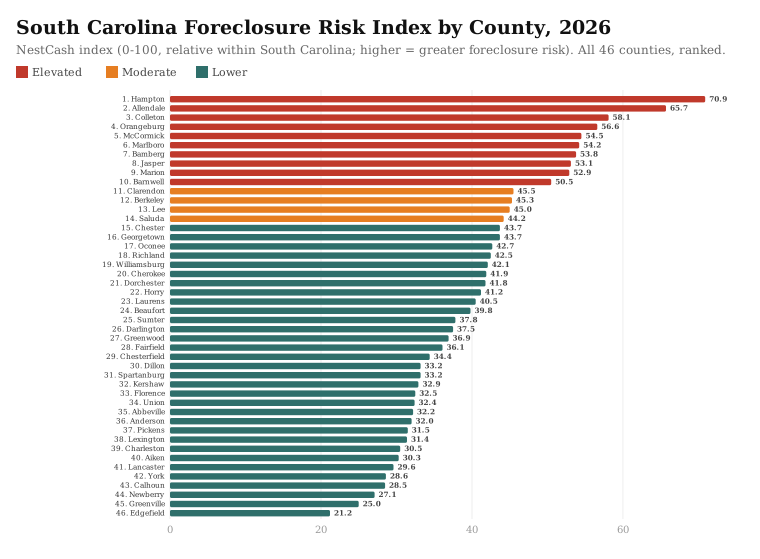
Hampton County tops the list at 70.9, and it is a fair portrait of the whole Elevated tier. A small, rural Lowcountry county between Charleston and Savannah, Hampton pairs the heaviest housing cost burden in the state, 40.4 percent of mortgaged owners spending more than 30 percent of income on housing, with 10.0 percent unemployment and a market where the typical home sits more than 100 days. Allendale follows at 65.7, then Colleton (58.1), Orangeburg (56.6), and McCormick (54.5) on the Georgia line. These are the counties strung along Interstate 95, the Savannah River, and the state’s southern and eastern edges, several of them the ones a generation of reporting has called the “Corridor of Shame.” The distress here is not the aftermath of a building boom. It is chronic rural poverty meeting high housing costs and thin local job markets, the conditions under which a single setback turns into a missed mortgage payment.
Two data points capture how deep it runs. Barnwell County, on the Savannah River, carries the second-heaviest cost burden in the state at 38.2 percent, behind only Hampton. Bamberg County’s unemployment rate is 11.9 percent, the highest in South Carolina. Orangeburg (56.6), the largest of the Elevated counties and home to two historically Black universities, ranks fourth.
The metros: the safest ground in a high-risk state
Now the counterintuitive part. In a state ranked second in the country for foreclosures, the places you have heard of are the safe ones. Greenville County, the Upstate’s economic hub, is the lowest-risk large county in South Carolina at 25.0. Charleston (30.5), Columbia’s Richland County (42.5), Myrtle Beach’s Horry County (41.2), and Beaufort (39.8), home to Hilton Head, all grade Lower. Their delinquency rates tell the story: Charleston at 0.5 percent and Beaufort at 0.7 percent are among the lowest in the state, a world away from the rural interior.
But the relative nature of this index matters most right here. These metros grade Lower against the rest of South Carolina, not against the country. In a state with the nation’s second-highest foreclosure rate, “the safest ground in South Carolina” is not the same as safe. The growth markets are insulated compared to Hampton or Bamberg, but they sit inside a state where foreclosure pressure is high everywhere by national standards. The one metropolitan county that breaks even the in-state pattern is Berkeley, in the fast-growing outer ring of the Charleston metro, which grades Moderate and carries the highest delinquency rate of any county in the state at 2.1 percent, a sign that the exurban edge of the boom is not as insulated as the core.
Rate versus volume
Risk per homeowner and total foreclosure volume are different measurements, and in South Carolina they point in opposite directions. The rural Elevated counties carry the highest risk per homeowner, but they are small, so their raw filing counts are modest. The metros carry lower risk per homeowner, but they hold most of the state’s people and homes, so they generate most of its foreclosures in absolute numbers. Richland, Charleston, Horry, and Greenville produce far more filings than Hampton or Bamberg ever could, simply because they are large. For a homeowner weighing their own exposure, the risk index is the relevant number. For anyone sizing the market, volume is. We report both, and in South Carolina the gap between them is unusually wide.
The quiet climb: how South Carolina reached second-worst
Most states at the top of the foreclosure tables have a crisis story. Florida, Arizona, and Nevada boomed and busted. Illinois and Ohio carry the long tail of Rust Belt decline. South Carolina has neither. It was not a top-ten foreclosure state in 2008, 2009, or 2010. It did not have a dramatic bubble, and it does not have a collapsed industrial base. Its rise to second in the nation has been gradual and undramatic, which is exactly why it has drawn so little notice.
Several slow-moving forces explain it. South Carolina’s judicial foreclosure process is comparatively fast for a court-based system, so cases move to filing rather than lingering. Incomes in the rural interior have stagnated while housing and insurance costs, especially coastal wind and flood coverage, have climbed. And the state’s rapid coastal and Upstate growth has pulled investment and attention toward the metros and away from the interior counties that carry the risk. The result is a foreclosure problem that is real, near the top of the national list, and concentrated in the places least equipped to absorb it, without ever having produced the kind of headline moment that puts a state on the map. That quiet is the most important thing to understand about foreclosure in South Carolina.
If you are a South Carolina homeowner facing foreclosure
This report is a market analysis, not legal advice, but the data points to a few things worth knowing. South Carolina is a judicial foreclosure state, which means a lender must file a lawsuit and move the case through the courts, usually before a Master-in-Equity or special referee, before a home can be sold. That court process gives a homeowner more time and more procedural rights than a fast, non-judicial state does, and it is worth using. After being served, you generally have about 30 days to respond and assert your options. One thing to understand clearly: South Carolina does not provide a general statutory right to redeem the home after the foreclosure sale, though the sale itself is often followed by a 30-day period during which higher bids can be entered when the lender has preserved the right to a deficiency judgment. The practical takeaway is that the window to act is before the sale, not after.
Because of that, acting early matters. Options like reinstatement, a loan modification, or selling the home before the sale can stop the process and limit the damage to your credit, since a foreclosure can remain on a credit report for up to seven years. NestCash works with South Carolina homeowners in exactly this situation. Our guide on how to sell a house in foreclosure walks through the timeline and the choices in more detail, and you can also start with a cash offer anywhere in the state through our South Carolina home-buying page.
The full data
All 46 counties, from highest to lowest Foreclosure Risk Index. An asterisk on the delinquency rate marks a county where the South Carolina statewide rate was substituted because the county’s own rate is not separately reported. See Methodology.
Market-softness figures come from Realtor.com’s July 2026 county file. In the state’s thinnest markets they rest on very few listings, so the price-cut share and median days on market for those counties carry more noise than the rest of the table: Allendale had 16 active listings, Lee 25, Saluda 29, Marlboro 31, Barnwell 35, and Bamberg and Calhoun 37 each.
| Rank | County | Risk Index | Grade | Price-cut share | Median DOM | Cost burden | 90+ delinquency | Unemployment |
|---|---|---|---|---|---|---|---|---|
| 1 | Hampton | 70.9 | Elevated | 16.5% | 109 | 40.4% | 1.2%* | 10.0% |
| 2 | Allendale | 65.7 | Elevated | 17.1% | 128 | 32.9% | 1.2%* | 10.8% |
| 3 | Colleton | 58.1 | Elevated | 18.7% | 73 | 36.2% | 1.2%* | 9.3% |
| 4 | Orangeburg | 56.6 | Elevated | 18.6% | 85 | 33.5% | 1.2%* | 9.3% |
| 5 | McCormick | 54.5 | Elevated | 19.4% | 110 | 32.3% | 1.2%* | 5.5% |
| 6 | Marlboro | 54.2 | Elevated | 15.2% | 65 | 37.3% | 1.2%* | 8.4% |
| 7 | Bamberg | 53.8 | Elevated | 13.9% | 83 | 31.3% | 1.2%* | 11.9% |
| 8 | Jasper | 53.1 | Elevated | 19.4% | 87 | 35.0% | 1.2%* | 5.1% |
| 9 | Marion | 52.9 | Elevated | 18.5% | 96 | 33.2% | 1.2%* | 5.9% |
| 10 | Barnwell | 50.5 | Elevated | 7.7% | 76 | 38.2% | 1.2%* | 7.2% |
| 11 | Clarendon | 45.5 | Moderate | 20.9% | 62 | 28.6% | 1.2%* | 8.6% |
| 12 | Berkeley | 45.3 | Moderate | 28.9% | 55 | 23.1% | 2.1% | 3.7% |
| 13 | Lee | 45.0 | Moderate | 18.3% | 41 | 35.7% | 1.2%* | 5.7% |
| 14 | Saluda | 44.2 | Moderate | 27.5% | 74 | 29.6% | 1.2%* | 2.4% |
| 15 | Chester | 43.7 | Lower | 15.7% | 76 | 30.3% | 1.2%* | 6.5% |
| 16 | Georgetown | 43.7 | Lower | 19.7% | 80 | 29.3% | 1.2%* | 5.1% |
| 17 | Oconee | 42.7 | Lower | 25.8% | 65 | 26.6% | 1.2%* | 6.1% |
| 18 | Richland | 42.5 | Lower | 22.7% | 49 | 26.2% | 1.6% | 6.6% |
| 19 | Williamsburg | 42.1 | Lower | 11.8% | 73 | 33.3% | 1.2%* | 4.9% |
| 20 | Cherokee | 41.9 | Lower | 23.2% | 69 | 26.5% | 1.2%* | 6.3% |
| 21 | Dorchester | 41.8 | Lower | 29.1% | 53 | 25.8% | 1.4% | 4.7% |
| 22 | Horry | 41.2 | Lower | 20.4% | 80 | 30.6% | 0.8% | 5.2% |
| 23 | Laurens | 40.5 | Lower | 32.0% | 52 | 25.6% | 1.2%* | 4.5% |
| 24 | Beaufort | 39.8 | Lower | 18.7% | 85 | 33.0% | 0.7% | 3.0% |
| 25 | Sumter | 37.8 | Lower | 13.5% | 58 | 28.9% | 1.2%* | 7.3% |
| 26 | Darlington | 37.5 | Lower | 18.1% | 67 | 25.6% | 1.2%* | 6.9% |
| 27 | Greenwood | 36.9 | Lower | 16.8% | 76 | 27.0% | 1.2%* | 4.7% |
| 28 | Fairfield | 36.1 | Lower | 23.9% | 57 | 24.7% | 1.2%* | 5.5% |
| 29 | Chesterfield | 34.4 | Lower | 16.5% | 72 | 22.2% | 1.2%* | 8.1% |
| 30 | Dillon | 33.2 | Lower | 20.8% | 55 | 23.1% | 1.2%* | 6.8% |
| 31 | Spartanburg | 33.2 | Lower | 23.8% | 58 | 21.3% | 1.5% | 4.3% |
| 32 | Kershaw | 32.9 | Lower | 24.6% | 51 | 23.6% | 1.2%* | 4.9% |
| 33 | Florence | 32.5 | Lower | 19.7% | 60 | 24.7% | 1.2%* | 4.7% |
| 34 | Union | 32.4 | Lower | 21.4% | 65 | 19.8% | 1.2%* | 7.7% |
| 35 | Abbeville | 32.2 | Lower | 15.2% | 65 | 27.5% | 1.2%* | 3.4% |
| 36 | Anderson | 32.0 | Lower | 23.6% | 64 | 20.6% | 1.3% | 5.1% |
| 37 | Pickens | 31.5 | Lower | 24.2% | 66 | 22.3% | 1.2%* | 3.5% |
| 38 | Lexington | 31.4 | Lower | 26.7% | 50 | 20.7% | 1.4% | 4.2% |
| 39 | Charleston | 30.5 | Lower | 25.9% | 58 | 27.9% | 0.5% | 3.6% |
| 40 | Aiken | 30.3 | Lower | 22.0% | 70 | 21.4% | 1.0% | 5.6% |
| 41 | Lancaster | 29.6 | Lower | 23.2% | 57 | 20.5% | 1.2%* | 5.5% |
| 42 | York | 28.6 | Lower | 26.7% | 53 | 19.9% | 1.2% | 4.4% |
| 43 | Calhoun | 28.5 | Lower | 7.3% | 73 | 23.4% | 1.2%* | 7.3% |
| 44 | Newberry | 27.1 | Lower | 18.3% | 65 | 22.2% | 1.2%* | 3.6% |
| 45 | Greenville | 25.0 | Lower | 24.7% | 57 | 20.5% | 0.9% | 4.3% |
| 46 | Edgefield | 21.2 | Lower | 9.0% | 70 | 19.5% | 1.2%* | 5.8% |
What we will watch
We plan to update this index quarterly. Three things will tell us where South Carolina goes from here: the statewide delinquency rate, which sits high and will show whether the pressure is still building, whether the risk stays contained in the rural interior or begins to reach the exurban edges of the metros the way Berkeley County hints it might, and whether the state’s national ranking holds at second or eases as the pandemic-era backlog clears. South Carolina is second in the country today, and it got there without anyone noticing. The next few quarters will show whether it stays there.
Sources and data
- Foreclosure activity and trend. ATTOM Data Solutions, 2026 Mid-Year U.S. Foreclosure Market Report and its quarterly and monthly reports. Used for statewide filing counts, the national rank, and the year-over-year change.
- Housing market softness. Realtor.com Economic Research, county inventory core metrics through July 2026. Used for the price-cut share, median days on market, and active listing counts.
- Housing, mortgage status, cost burden, and unemployment. U.S. Census Bureau, American Community Survey five-year estimates. Used for county housing counts, the mortgaged-owner universe, housing cost burden, and the unemployment rate.
- Mortgage delinquency. CFPB Mortgage Performance Trends, data through December 2025. Used for the 90-or-more day delinquency rates.
About NestCash
NestCash buys houses for cash in twelve states, including throughout South Carolina. We publish original housing research to help homeowners, buyers, and investors understand the markets we work in. This report may be cited and its charts embedded with attribution to NestCash.

John is the Founder of NestCash and a leading voice in real estate investing and housing market strategy. With experience across 12 states, he helps buyers, sellers, and investors make smarter decisions using real-world insight and market data.