
The 2026 Texas Foreclosure Risk Index
Where financial pressure on Texas homeowners is building, county by county
 Published on August 6th, 2026, by John Carter | Founder, NestCash
Original NestCash research, free to read and cite. If you need to sell a house fast in Texas, start here.

Abstract
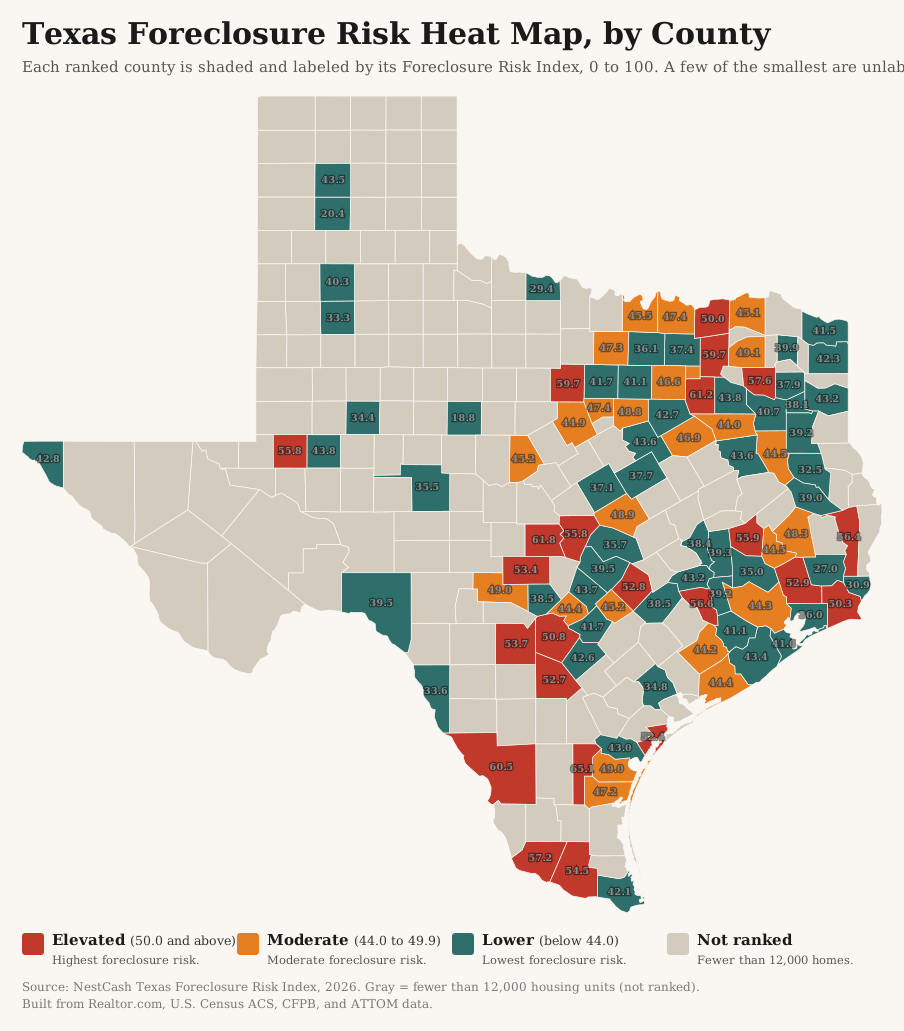
Texas has a foreclosure story that only makes sense once you separate two numbers people constantly confuse: rate and volume. By rate, Texas is unremarkable. It recorded about 22,000 foreclosure filings in the first half of 2026, up roughly 20 percent from a year earlier, which works out to one filing for every 551 housing units and ranks the state 12th in the country, squarely mid-pack. By raw volume, Texas is the biggest foreclosure market in America. It led all 50 states in foreclosure starts in the first quarter of 2026, more than California and more than Florida, because it is the second-largest state and simply has more homes to count. Neither number tells you where the pressure actually sits. To find that, we built the Texas Foreclosure Risk Index, a county-level measure that combines market softness, mortgage cost burden, mortgage delinquency, and unemployment into a single score from 0 to 100. What it shows runs against the usual assumption that housing stress lives in the big metros. The strain is in South Texas and along the border, in the old industrial and energy counties, and in the rural exurbs at the outer edge of the Dallas and Houston orbits, while booming Austin and the affluent inner suburbs of Dallas are the safest of the major metros. One large metro breaks the pattern: San Antonio.
We score each county from 0 to 100 by blending four public signals, each weighted by how directly it bears on a mortgaged homeowner: market softness (35 percent), mortgage cost burden (30 percent), 90-day mortgage delinquency (20 percent), and unemployment (15 percent). Each signal is min-max normalized within Texas, so the score ranks counties against one another in the state, not against a national or absolute standard. A county grades Elevated at 50 or above, Moderate from 44 to 49.9, and Lower below 44. One rule matters for a state this size: we only rank the 101 counties with at least 12,000 housing units. Texas has 254 counties, and many are tiny and rural, where a single stale listing or a handful of mortgages can swing a percentage wildly. Those smaller counties stay in the data but are not ranked, so a county with 500 homes never lands at the top of a statewide list on noise alone. The full weighting, the normalization, and the honest limits of the data are spelled out in the methodology section below.
Key findings
- Texas is mid-pack by rate and first by volume. First-half 2026 filings totaled about 22,000, up 19.7 percent year over year and 40.9 percent over 2024 (ATTOM Data Solutions). At one filing per 551 housing units the state ranks 12th nationally, yet it led all 50 states in foreclosure starts in the first quarter, because size, not distress, drives the raw count.
- The pressure is rural, border, and energy, not metro. Of the 101 ranked counties, 23 grade Elevated. They lead with Jim Wells (65.1) in South Texas, Llano (61.8) in the Hill Country, Kaufman (61.2) and Hunt (59.7) on the outer edge of the Dallas metro, and Webb (60.5), home to Laredo, which carries the highest mortgage delinquency rate in the state at 2.5 percent.
- San Antonio is the one big metro under real pressure. Bexar County grades Elevated at 50.8, the only major metropolitan county in that tier. It pairs the state’s softest large-metro market with a delinquency rate of 1.5 percent, above Dallas and Houston.
- Booming Austin is the safest of the major metros. Travis County scores 39.5 and carries a 90-day delinquency rate of just 0.5 percent, the lowest of any county in the state. The Austin ring (Williamson 35.7, Hays 43.7) and the affluent inner Dallas suburbs (Collin 37.4, Denton 36.1) all grade Lower on strong jobs and rising incomes.
- Delinquency is low but uneven. Texas’s statewide serious delinquency rate (90 or more days past due) was 1.2 percent in December 2025 (CFPB). It runs hottest in Webb (2.5 percent), Ector (2.3 percent), and Jefferson (2.1 percent), and coolest in Austin’s Travis County (0.5 percent) and the Brazos Valley (0.6 percent).
Methodology
Data and sources
We built the index entirely from public and openly licensed data, and we cite each source at the point of use. Market conditions come from Realtor.com Economic Research (county listing data through July 2026). Housing tenure, mortgage status, cost burden, county housing counts, and unemployment come from the U.S. Census Bureau’s American Community Survey five-year estimates. Mortgage delinquency comes from the Consumer Financial Protection Bureau’s Mortgage Performance Trends (latest data December 2025). Statewide filing counts, the national rank, and trend come from ATTOM Data Solutions’ published foreclosure market reports. Every dataset we used is free and publicly available.
Building the index
The Texas Foreclosure Risk Index uses the same formula as every state in this series, a weighted blend of four signals, each chosen because it precedes or predicts foreclosure among homeowners who carry a mortgage:
35%
The share of active listings with a price cut and the median days a home sits on the market. A soft market matters because a homeowner in trouble who cannot sell quickly has fewer ways to avoid foreclosure.
30%
The share of owners with a mortgage who spend more than 30 percent of household income on housing. This is direct payment stress on the exact population that can be foreclosed on.
20%
The 90-day-or-more delinquency rate, the clearest early warning that foreclosures are coming.
15%
A secondary driver. We hold its weight down deliberately, because unemployment also captures renters and therefore dilutes a signal meant to describe homeowners.
We normalized each signal across the ranked counties on a 0-to-1 scale, where 0 is the lowest value in Texas and 1 is the highest, then applied the weights above and multiplied by 100. The result is a relative score: it ranks counties against one another within Texas, not against a national or absolute standard. We then graded each county by its score, Elevated for 50 or above, Moderate for 44 to 49.9, and Lower for anything below 44. Twenty-three counties land in the Elevated tier, twenty-five in Moderate, and fifty-three in Lower.
Limitations
Three limits are worth stating plainly. First, we rank only the 101 counties with at least 12,000 housing units. Texas has 254 counties, and in the smallest of them a single price-cut or a handful of mortgages produces wild percentages, so ranking them would put statistical noise at the top of the list. Those counties remain in the underlying data and are shaded gray on the map, but they are not ranked. Second, the CFPB reports county delinquency only where a county has enough mortgages to protect borrower privacy, so for 66 of the 101 ranked counties we substituted the Texas statewide rate of 1.2 percent. Because that component carries 20 percent of the weight, the substitution mainly affects the smaller counties and leaves the metros, which do report their own rates, unaffected. Third, the index measures leading pressure, not completed foreclosures. Where our scores and realized foreclosure activity disagree, we say so rather than force a match.
Findings
The index: pressure at the edges, calm in the boomtowns
Ranked from most to least risk, the index tells a story that runs against the assumption that a state’s housing stress lives in its biggest, fastest-growing cities.
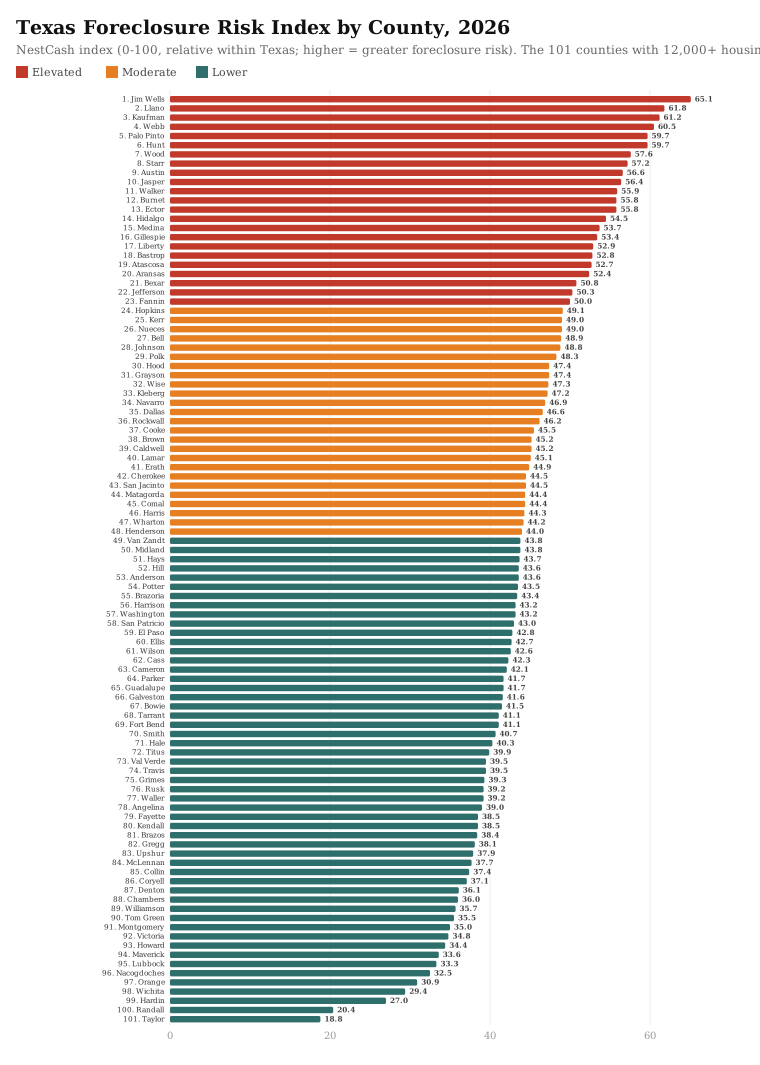
The counties at the top are a mix of South Texas, the Hill Country, the energy patch, and the rural exurbs at the far edge of the big metros. They share a pattern: modest incomes stretched against housing costs, slow resale markets, and thin local job bases. Jim Wells County, around Alice in South Texas, tops the list at 65.1 on a heavy cost burden of 36.6 percent, a slow market where the typical home sits 120 days, and unemployment above 6 percent. Llano and Palo Pinto, in the Hill Country west of Austin and Fort Worth, follow on some of the heaviest cost burdens in the state, near 38 and 39 percent.
The exceptions to the rural rule are telling. Kaufman (61.2) and Hunt (59.7) sit third and sixth, and both are outer-ring Dallas exurbs where fast growth has run ahead of incomes. Webb County (60.5), home to Laredo, ranks fourth and carries the highest serious delinquency rate in Texas at 2.5 percent. Ector County (55.8), around Odessa in the Permian Basin, pairs a fast-turning market with a 2.3 percent delinquency rate, the mark of an economy tied to the price of oil.
The border itself is not uniformly stressed, and that is worth underlining. The pressure sits in South Texas and the Rio Grande Valley, in Webb, Hidalgo, and Starr, while the state’s largest border metro is the calm exception. El Paso County grades Lower at 42.8, carrying a delinquency rate near the statewide average and a steady, government-and-military-anchored job base that the Valley’s trade-driven economy does not share.
San Antonio, the one big metro under pressure
In most states the biggest metros sit at one end of the risk spectrum or the other. Texas splits them. Bexar County, home to San Antonio, is the single large metropolitan county in the Elevated tier, scoring 50.8. It carries the softest market of the major metros, a delinquency rate of 1.5 percent that runs above both Dallas and Houston, and a cost burden that reflects incomes which have not kept pace with the rest of the Texas Triangle. San Antonio has long been the most affordable of the state’s big cities, and that affordability has a flip side: a thinner cushion when a homeowner falls behind.
Booming Austin and the affluent suburbs are the safest of the major metros
At the other end sits the Texas growth machine. Travis County, home to Austin, scores 39.5 and carries a 90-day delinquency rate of just 0.5 percent, the lowest of any county in the state. Its surrounding ring grades Lower across the board, with Williamson at 35.7 and Hays at 43.7. The affluent inner suburbs north of Dallas tell the same story: Collin County, home to Plano and Frisco, scores 37.4, and Denton scores 36.1, both on strong job growth, in-migration, and rising incomes that keep their homeowners well ahead of trouble. Among the very largest counties, Dallas (46.6) and Harris, home to Houston (44.3), land in the middle of the Moderate tier, while Tarrant, home to Fort Worth (41.1), grades Lower.
Rate versus volume
Risk per homeowner and total foreclosure volume are different measurements, and nowhere is the gap wider than in Texas. Harris County alone holds well over 1.7 million housing units, and Dallas County more than a million, so even a middling rate in those places produces more filings in raw numbers than a high rate in a county like Jim Wells or Webb. This is why Texas can lead the entire country in foreclosure starts while ranking 12th by rate: the state is enormous, and volume follows population. For a homeowner weighing their own exposure, the risk index is the relevant number. For anyone sizing the market, volume is. We report both and caution against collapsing them into one claim, because the headline that Texas leads the nation in foreclosure starts is true and, on its own, misleading.
Leading indicators against realized activity
The index is built from housing composition and payment stress, not foreclosure filings, so it is worth asking whether it agrees with data collected a different way. It does, directionally. ATTOM’s reports name Houston and Dallas as the Texas metros with the most raw foreclosure activity, which is the volume story: the biggest metros generate the most filings. Our per-homeowner risk index puts those same metros in the middle of the pack (Dallas 35th, Harris 46th) and pushes the border, energy, and rural-exurb counties to the top. The two measures are not in conflict. One counts where the most foreclosures happen in absolute terms, and the other measures where an individual homeowner is most exposed. Read together, they describe a state whose foreclosure volume is concentrated in its metros while its foreclosure risk is concentrated at its edges.
What is driving the 2026 rise
Texas’s increase is best understood as a return to normal after years of suppressed activity, not the front edge of a crisis. Foreclosure filings were held down through the pandemic by moratoria and forbearance, and by a labor market that kept most Texas owners current. As those supports ended, filings drifted back up, which is why the year-over-year numbers look large: they are measured against an artificially low base.
The new strain is concentrated where the index flags it. Serious delinquency is highest in the border and energy counties, where local economies swing with trade and oil. Home prices that ran up through the recent boom remain high relative to incomes in South Texas and the Hill Country, which keeps cost burden elevated in the counties at the top of the list. And mortgage rates that have stayed higher for longer have removed the refinance escape valve that used to let a stretched owner lower a payment.
How today compares to the last crash
For all the recent acceleration, Texas has never had the boom-and-bust that defined the last housing crisis elsewhere. While Florida, Arizona, and Nevada saw prices double and then collapse, Texas stayed comparatively steady, and its foreclosure rate held near or below the national average through the worst of 2008 to 2012. A large part of the reason is structural and specific to Texas. The Texas Constitution sharply limits home-equity borrowing, capping most home-equity loans so that total mortgage debt cannot exceed 80 percent of a home’s value. Texas homeowners entered the last crisis with more equity and less room to strip it out, which left fewer of them underwater when prices fell. That same guardrail still shapes the state today. The pressure the index measures is an affordability and local-economy story in specific corners of Texas, not a statewide debt overhang.
If you are a Texas homeowner facing foreclosure
This report is a market analysis, not legal advice, but the data points to a few things worth knowing. Texas is a non-judicial foreclosure state, and it moves faster than almost anywhere in the country. Most Texas foreclosures are conducted through a power-of-sale clause in the deed of trust, without a lawsuit. After the required notices, foreclosure sales are held on the first Tuesday of the month, and a lender generally must give at least 21 days’ notice before that sale. That compressed timeline is the single most important thing for a Texas owner to understand, because it leaves less room to catch up than in judicial-foreclosure states.
The upside of acting early is real. Options like reinstatement, a loan modification, or selling the home before the sale can stop the process and limit the damage to your credit, since a foreclosure can remain on a credit report for up to seven years. NestCash works with Texas homeowners in exactly this situation. Our guide on how to sell a house in foreclosure walks through the timeline and the choices in more detail, and you can also start with a cash offer anywhere in the state through our Texas home-buying page.
The full data
The 101 ranked counties, from highest to lowest Foreclosure Risk Index. An asterisk on the delinquency rate marks a county where the Texas statewide rate was substituted because the county’s own rate is not separately reported. See Methodology.
| Rank | County | Risk Index | Grade | Price-cut share | Median DOM | Cost burden | 90+ delinquency | Unemployment |
|---|---|---|---|---|---|---|---|---|
| 1 | Jim Wells | 65.1 | Elevated | 19.1% | 120 | 36.6% | 1.2%* | 6.1% |
| 2 | Llano | 61.8 | Elevated | 20.7% | 99 | 38.2% | 1.2%* | 4.4% |
| 3 | Kaufman | 61.2 | Elevated | 27.3% | 63 | 33.8% | 1.9% | 5.3% |
| 4 | Webb | 60.5 | Elevated | 14.0% | 69 | 34.8% | 2.5% | 5.5% |
| 5 | Palo Pinto | 59.7 | Elevated | 16.1% | 88 | 39.0% | 1.2%* | 6.1% |
| 6 | Hunt | 59.7 | Elevated | 27.9% | 70 | 35.8% | 1.2%* | 5.9% |
| 7 | Wood | 57.6 | Elevated | 21.6% | 77 | 36.1% | 1.2%* | 6.3% |
| 8 | Starr | 57.2 | Elevated | 6.9% | 85 | 38.2% | 1.2%* | 10.4% |
| 9 | Austin | 56.6 | Elevated | 21.3% | 76 | 37.6% | 1.2%* | 4.3% |
| 10 | Jasper | 56.4 | Elevated | 21.6% | 86 | 27.2% | 1.2%* | 13.3% |
| 11 | Walker | 55.9 | Elevated | 16.7% | 68 | 36.2% | 1.2%* | 8.9% |
| 12 | Burnet | 55.8 | Elevated | 25.8% | 100 | 32.9% | 1.2%* | 2.6% |
| 13 | Ector | 55.8 | Elevated | 25.9% | 47 | 29.6% | 2.3% | 5.9% |
| 14 | Hidalgo | 54.5 | Elevated | 15.2% | 81 | 31.8% | 1.7% | 7.6% |
| 15 | Medina | 53.7 | Elevated | 24.5% | 93 | 32.7% | 1.2%* | 3.0% |
| 16 | Gillespie | 53.4 | Elevated | 14.1% | 98 | 37.4% | 1.2%* | 2.7% |
| 17 | Liberty | 52.9 | Elevated | 20.9% | 72 | 33.1% | 1.2%* | 7.1% |
| 18 | Bastrop | 52.8 | Elevated | 22.7% | 83 | 33.2% | 1.2%* | 4.3% |
| 19 | Atascosa | 52.7 | Elevated | 23.2% | 85 | 32.8% | 1.2%* | 4.1% |
| 20 | Aransas | 52.4 | Elevated | 20.5% | 99 | 31.9% | 1.2%* | 4.1% |
| 21 | Bexar | 50.8 | Elevated | 26.6% | 60 | 29.6% | 1.5% | 5.8% |
| 22 | Jefferson | 50.3 | Elevated | 18.0% | 65 | 28.2% | 2.1% | 6.3% |
| 23 | Fannin | 50.0 | Elevated | 29.2% | 76 | 28.3% | 1.2%* | 5.0% |
| 24 | Hopkins | 49.1 | Moderate | 22.7% | 80 | 31.3% | 1.2%* | 4.0% |
| 25 | Kerr | 49.0 | Moderate | 20.9% | 77 | 33.3% | 1.2%* | 3.3% |
| 26 | Nueces | 49.0 | Moderate | 20.2% | 88 | 30.2% | 1.2% | 5.2% |
| 27 | Bell | 48.9 | Moderate | 22.5% | 71 | 29.9% | 1.2% | 6.8% |
| 28 | Johnson | 48.8 | Moderate | 26.3% | 58 | 27.9% | 1.9% | 3.6% |
| 29 | Polk | 48.3 | Moderate | 20.4% | 73 | 29.0% | 1.2%* | 8.1% |
| 30 | Hood | 47.4 | Moderate | 26.6% | 58 | 29.8% | 1.2%* | 5.6% |
| 31 | Grayson | 47.4 | Moderate | 24.9% | 72 | 28.2% | 1.6% | 3.1% |
| 32 | Wise | 47.3 | Moderate | 29.8% | 66 | 27.2% | 1.2%* | 5.3% |
| 33 | Kleberg | 47.2 | Moderate | 17.9% | 66 | 30.9% | 1.2%* | 7.7% |
| 34 | Navarro | 46.9 | Moderate | 20.5% | 74 | 31.4% | 1.2%* | 4.4% |
| 35 | Dallas | 46.6 | Moderate | 26.4% | 56 | 32.3% | 0.9% | 5.0% |
| 36 | Rockwall | 46.2 | Moderate | 28.5% | 58 | 25.0% | 1.8% | 4.3% |
| 37 | Cooke | 45.5 | Moderate | 30.6% | 81 | 24.1% | 1.2%* | 4.5% |
| 38 | Brown | 45.2 | Moderate | 24.9% | 78 | 26.5% | 1.2%* | 5.3% |
| 39 | Caldwell | 45.2 | Moderate | 22.0% | 86 | 28.6% | 1.2%* | 3.4% |
| 40 | Lamar | 45.1 | Moderate | 20.6% | 69 | 31.2% | 1.2%* | 4.0% |
| 41 | Erath | 44.9 | Moderate | 20.3% | 65 | 30.1% | 1.2%* | 5.7% |
| 42 | Cherokee | 44.5 | Moderate | 16.2% | 68 | 32.0% | 1.2%* | 5.2% |
| 43 | San Jacinto | 44.5 | Moderate | 16.2% | 82 | 28.4% | 1.2%* | 6.8% |
| 44 | Matagorda | 44.4 | Moderate | 13.9% | 90 | 26.5% | 1.2%* | 8.7% |
| 45 | Comal | 44.4 | Moderate | 28.1% | 77 | 29.3% | 0.7% | 3.9% |
| 46 | Harris | 44.3 | Moderate | 20.0% | 47 | 30.1% | 1.4% | 6.7% |
| 47 | Wharton | 44.2 | Moderate | 16.4% | 72 | 31.4% | 1.2%* | 4.9% |
| 48 | Henderson | 44.0 | Moderate | 25.6% | 80 | 25.4% | 1.2%* | 4.9% |
| 49 | Van Zandt | 43.8 | Lower | 24.0% | 69 | 29.0% | 1.2%* | 3.5% |
| 50 | Midland | 43.8 | Lower | 30.1% | 46 | 28.6% | 1.3% | 3.4% |
| 51 | Hays | 43.7 | Lower | 26.9% | 67 | 29.0% | 0.9% | 4.4% |
| 52 | Hill | 43.6 | Lower | 23.8% | 71 | 28.0% | 1.2%* | 4.2% |
| 53 | Anderson | 43.6 | Lower | 22.1% | 91 | 24.2% | 1.2%* | 6.0% |
| 54 | Potter | 43.5 | Lower | 19.9% | 53 | 32.9% | 1.2%* | 3.8% |
| 55 | Brazoria | 43.4 | Lower | 20.1% | 58 | 26.9% | 1.8% | 4.7% |
| 56 | Harrison | 43.2 | Lower | 21.5% | 79 | 26.4% | 1.2%* | 5.6% |
| 57 | Washington | 43.2 | Lower | 21.9% | 83 | 28.1% | 1.2%* | 3.0% |
| 58 | San Patricio | 43.0 | Lower | 17.7% | 80 | 29.1% | 1.2%* | 4.5% |
| 59 | El Paso | 42.8 | Lower | 11.0% | 65 | 33.1% | 1.2% | 6.0% |
| 60 | Ellis | 42.7 | Lower | 23.7% | 53 | 27.6% | 1.5% | 4.5% |
| 61 | Wilson | 42.6 | Lower | 22.5% | 82 | 26.9% | 1.2%* | 3.6% |
| 62 | Cass | 42.3 | Lower | 15.3% | 103 | 24.6% | 1.2%* | 6.4% |
| 63 | Cameron | 42.1 | Lower | 13.1% | 78 | 29.7% | 1.2% | 5.9% |
| 64 | Parker | 41.7 | Lower | 29.5% | 61 | 26.1% | 1.1% | 4.0% |
| 65 | Guadalupe | 41.7 | Lower | 28.0% | 65 | 24.8% | 1.2% | 4.8% |
| 66 | Galveston | 41.6 | Lower | 19.3% | 72 | 28.0% | 1.1% | 5.7% |
| 67 | Bowie | 41.5 | Lower | 18.0% | 84 | 27.4% | 1.2%* | 4.4% |
| 68 | Tarrant | 41.1 | Lower | 27.6% | 50 | 28.3% | 1.0% | 4.7% |
| 69 | Fort Bend | 41.1 | Lower | 22.1% | 43 | 30.3% | 1.2% | 5.1% |
| 70 | Smith | 40.7 | Lower | 24.5% | 66 | 25.4% | 1.3% | 4.4% |
| 71 | Hale | 40.3 | Lower | 21.2% | 76 | 25.2% | 1.2%* | 5.3% |
| 72 | Titus | 39.9 | Lower | 19.9% | 81 | 27.0% | 1.2%* | 3.1% |
| 73 | Val Verde | 39.5 | Lower | 12.8% | 92 | 26.0% | 1.2%* | 5.9% |
| 74 | Travis | 39.5 | Lower | 28.2% | 69 | 27.7% | 0.5% | 4.6% |
| 75 | Grimes | 39.3 | Lower | 11.5% | 67 | 30.9% | 1.2%* | 5.1% |
| 76 | Rusk | 39.2 | Lower | 22.4% | 76 | 24.6% | 1.2%* | 4.5% |
| 77 | Waller | 39.2 | Lower | 18.5% | 48 | 28.4% | 1.2%* | 6.8% |
| 78 | Angelina | 39.0 | Lower | 16.5% | 89 | 23.7% | 1.2%* | 6.4% |
| 79 | Fayette | 38.5 | Lower | 22.7% | 93 | 23.6% | 1.2%* | 2.3% |
| 80 | Kendall | 38.5 | Lower | 18.8% | 63 | 27.6% | 1.2%* | 4.7% |
| 81 | Brazos | 38.4 | Lower | 23.1% | 70 | 28.6% | 0.6% | 4.7% |
| 82 | Gregg | 38.1 | Lower | 25.3% | 62 | 25.2% | 1.2%* | 3.6% |
| 83 | Upshur | 37.9 | Lower | 25.1% | 68 | 22.2% | 1.2%* | 5.8% |
| 84 | McLennan | 37.7 | Lower | 21.9% | 67 | 26.5% | 1.0% | 4.5% |
| 85 | Collin | 37.4 | Lower | 31.2% | 53 | 26.0% | 0.7% | 4.2% |
| 86 | Coryell | 37.1 | Lower | 17.2% | 72 | 23.8% | 1.2%* | 7.1% |
| 87 | Denton | 36.1 | Lower | 29.0% | 51 | 26.7% | 0.7% | 4.0% |
| 88 | Chambers | 36.0 | Lower | 17.5% | 52 | 25.6% | 1.2%* | 7.3% |
| 89 | Williamson | 35.7 | Lower | 30.4% | 60 | 24.5% | 0.7% | 3.9% |
| 90 | Tom Green | 35.5 | Lower | 18.4% | 55 | 27.8% | 1.2%* | 3.7% |
| 91 | Montgomery | 35.0 | Lower | 20.9% | 49 | 26.9% | 1.1% | 4.6% |
| 92 | Victoria | 34.8 | Lower | 18.6% | 65 | 25.1% | 1.2%* | 4.4% |
| 93 | Howard | 34.4 | Lower | 23.4% | 66 | 21.3% | 1.2%* | 5.4% |
| 94 | Maverick | 33.6 | Lower | 12.6% | 35 | 28.5% | 1.2%* | 7.7% |
| 95 | Lubbock | 33.3 | Lower | 19.2% | 45 | 27.6% | 1.0% | 4.9% |
| 96 | Nacogdoches | 32.5 | Lower | 13.2% | 68 | 23.3% | 1.2%* | 7.0% |
| 97 | Orange | 30.9 | Lower | 17.8% | 63 | 21.5% | 1.2%* | 6.0% |
| 98 | Wichita | 29.4 | Lower | 19.1% | 48 | 24.2% | 1.2%* | 3.7% |
| 99 | Hardin | 27.0 | Lower | 18.0% | 73 | 17.8% | 1.2%* | 5.4% |
| 100 | Randall | 20.4 | Lower | 18.5% | 42 | 22.6% | 0.8% | 2.9% |
| 101 | Taylor | 18.8 | Lower | 9.8% | 37 | 24.1% | 1.2%* | 2.6% |
What we will watch
We plan to update this index quarterly. Three things will tell us whether Texas’s slow climb is turning into something larger: the serious delinquency rate, which is the earliest honest signal and runs hottest today in the border and energy counties, whether the strain stays contained at the edges or spreads toward the metros, and whether the outer-ring exurbs of Dallas and Houston, where fast growth has outrun incomes, begin to see filings arrive. Texas sits 12th nationally by rate today and leads the country by volume. The question the next few quarters will answer is whether the rate starts to catch up to the size.
Sources and data
- Foreclosure activity and trend. ATTOM Data Solutions, 2026 Mid-Year U.S. Foreclosure Market Report and its quarterly reports. Used for statewide filing counts, the national rank, the year-over-year change, and the first-quarter foreclosure-starts figure.
- Housing market softness. Realtor.com Economic Research, county inventory core metrics through July 2026. Used for the price-cut share, median days on market, and active listing counts.
- Housing, mortgage status, cost burden, and unemployment. U.S. Census Bureau, American Community Survey five-year estimates. Used for county housing counts, the mortgaged-owner universe, housing cost burden, and the unemployment rate.
- Mortgage delinquency. CFPB Mortgage Performance Trends, data through December 2025. Used for the 90-or-more day delinquency rates.
About NestCash
NestCash buys houses for cash in twelve states, including throughout Texas. We publish original housing research to help homeowners, buyers, and investors understand the markets we work in. This report may be cited and its charts embedded with attribution to NestCash.

John is the Founder of NestCash and a leading voice in real estate investing and housing market strategy. With experience across 12 states, he helps buyers, sellers, and investors make smarter decisions using real-world insight and market data.