
The 2026 Colorado Foreclosure Risk Index
Where financial pressure on Colorado homeowners is building, county by county
 Published on August 21st, 2026, by John Carter | Founder, NestCash
Original NestCash research, free to read and cite. If you need to sell a house fast in Colorado, start here.

Abstract
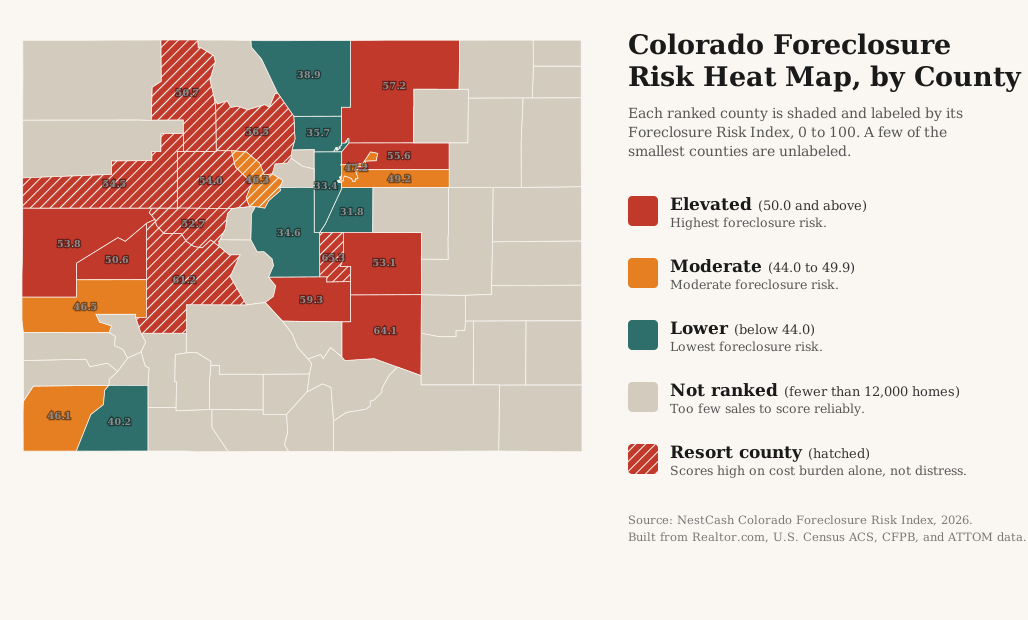
Colorado’s foreclosure story in 2026 is about momentum, not severity. The state still ranks a modest 17th in the nation by foreclosure rate, with about 3,943 filings in the first half of the year, one for every 657 housing units, and its serious mortgage delinquency rate, 0.7 percent, is among the lowest of any state. But the trend is the steepest in this series: filings are up roughly 57 percent from a year earlier and 121 percent over two years, the Front Range boom cooling fast off a very low base. To map where that pressure is landing, we built the Colorado Foreclosure Risk Index, a county-level measure that scores counties from 0 to 100 by combining market softness, mortgage cost burden, mortgage delinquency, and unemployment. It finds the real risk concentrated in two places. The first is Pueblo, the old steel city that carries the highest measured delinquency in the state. The second is the fast-growth Front Range exurbs north and east of Denver, Weld County around Greeley and Adams County, where a decade of rapid building and rising payments outran local incomes. The affluent core of the Front Range, from Boulder to Douglas County to the Larimer County suburbs, is the safest ground in Colorado. And one large group of high-scoring counties is not distress at all: the mountain resort towns, from Aspen to Vail to Steamboat, rank high purely because housing costs there are extreme, even though almost no one is missing a payment. We flag those counties throughout, because the difference between an expensive place and a distressed one is the whole point of reading this map correctly.
We score each county from 0 to 100 by blending four public signals, each weighted by how directly it bears on a mortgaged homeowner: market softness (35 percent), mortgage cost burden (30 percent), 90-day mortgage delinquency (20 percent), and unemployment (15 percent). Each signal is min-max normalized within Colorado, so the score ranks counties against one another in the state, not against a national or absolute standard. A county grades Elevated at 50 or above, Moderate from 44 to 49.9, and Lower below 44. One rule keeps the ranking honest: we rank the 26 counties with at least 12,000 housing units. Colorado has 64 counties, and most of them, the tiny mountain and eastern-plains counties, have too few home sales to score their market reliably. Those counties stay in the data but are not ranked, so a county with a few thousand homes never lands at the top of a statewide list on noise alone. The full weighting, the normalization, and the honest limits of the data, including how we handle the resort counties, are spelled out in the methodology section below.
Key findings
- Colorado’s foreclosure count is rising faster than any state in this series, but from a very low base. Filings are up about 121 percent over two years and 57 percent year over year (ATTOM), yet the state still ranks only 17th nationally by rate, one filing per 657 housing units, and its 0.7 percent serious delinquency rate is near the lowest in the country. The story is a fast climb from a quiet floor, not a crisis.
- Pueblo is the clearest case of real distress. Pueblo County grades Elevated at 64.1 and carries the highest measured mortgage delinquency in the state at 2.0 percent, roughly triple the Colorado rate. It is an old steel city with lower incomes than the Front Range around it, and it is the one large county where high cost burden and rising missed payments line up.
- The fast-growth exurbs carry the rest of the measured risk. Weld County around Greeley (57.2, delinquency 1.3 percent) and Adams County northeast of Denver (55.6, 1.1 percent) are where a decade of rapid building and rising payments ran ahead of local incomes. These, with Pueblo, are the counties where the delinquency evidence is real rather than substituted.
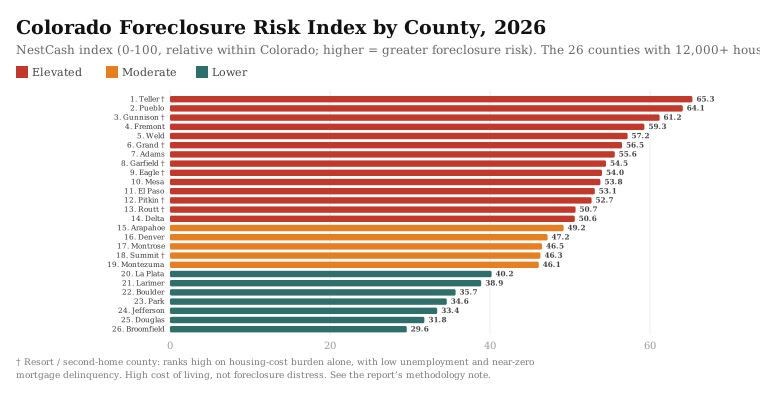
- Half of the Elevated tier is a resort cost-of-living artifact, not distress. Eight high-scoring counties, from Pitkin (Aspen) and Eagle (Vail) to Routt (Steamboat), Gunnison, Grand, Summit, Garfield, and Teller, rank up chiefly on extreme housing cost burden while posting near-full employment and no measured delinquency. Aspen’s Pitkin County sits at number 12 on cost burden alone. We mark these counties on both charts so the mountain red is not read as a foreclosure wave.
- The affluent Front Range is the safest ground in the state. Boulder County scores 35.7 with a 0.2 percent delinquency rate, the lowest in Colorado, and Douglas, Jefferson, and the Larimer County suburbs around Fort Collins all grade Lower. Where the modern Colorado economy is concentrated and incomes are high, foreclosure risk is low.
Methodology
Data and sources
We built the index entirely from public and openly licensed data, and we cite each source at the point of use. Market conditions come from Realtor.com Economic Research (county listing data through July 2026). Housing tenure, mortgage status, cost burden, county housing counts, and unemployment come from the U.S. Census Bureau’s American Community Survey five-year estimates. Mortgage delinquency comes from the Consumer Financial Protection Bureau’s Mortgage Performance Trends (latest data December 2025). Statewide filing counts, the national rank, and the trend come from ATTOM Data Solutions’ published foreclosure reports. Every dataset we used is free and publicly available.
Building the index
The Colorado Foreclosure Risk Index uses the same formula as every state in this series, a weighted blend of four signals, each chosen because it precedes or predicts foreclosure among homeowners who carry a mortgage:
35%
The share of active listings with a price cut and the median days a home sits on the market. A soft market matters because a homeowner in trouble who cannot sell quickly has fewer ways to avoid foreclosure.
30%
The share of owners with a mortgage who spend more than 30 percent of household income on housing. This is direct payment stress on the exact population that can be foreclosed on, and in Colorado it is also the signal that needs the most careful reading.
20%
The 90-day-or-more delinquency rate, the clearest early warning that foreclosures are coming. In Colorado this is the signal that separates genuine distress from mere expense.
15%
A secondary driver. We hold its weight down deliberately, because unemployment also captures renters and therefore dilutes a signal meant to describe homeowners.
We normalized each signal across the ranked counties on a 0-to-1 scale, where 0 is the lowest value in Colorado and 1 is the highest, then applied the weights above and multiplied by 100. The result is a relative score: it ranks counties against one another within Colorado, not against a national or absolute standard. We then graded each county by its score, Elevated for 50 or above, Moderate for 44 to 49.9, and Lower for anything below 44. Fourteen counties land in the Elevated tier, five in Moderate, and seven in Lower.
Limitations
Four limits are worth stating plainly, and in Colorado the third is the most important one on the page.
First, we rank the 26 counties with at least 12,000 housing units, but that floor counts homes, not homes for sale. A few of the smaller ranked counties have thin active-listing markets, so their market-softness component, 35 percent of the score, rests on a small sample and should be read as the least reliable input behind those specific rankings. The cost-burden figures and the broader regional pattern are the more robust signals.
Second, the delinquency data is substituted for many counties. The CFPB reports county delinquency only where a county has enough mortgages to protect borrower privacy, so for 15 of the 26 ranked counties we substituted the Colorado statewide rate of 0.7 percent. This matters for how to read the map: the measured-delinquency evidence exists for the large counties, and it points clearly at Pueblo (2.0 percent), Weld (1.3 percent), and Adams (1.1 percent). Where a county’s rate is substituted, its rank rests on cost burden and market softness, not on observed missed payments.
Third, and most important in Colorado, cost burden means two very different things here, and the index cannot tell them apart on its own. In a working county like Pueblo or Fremont, a high cost burden reflects modest incomes stretched by housing payments, and it is a distress signal. In a mountain resort county like Pitkin, Eagle, Routt, or Gunnison, a high cost burden reflects some of the most expensive real estate in the country sitting atop a small, well-employed local workforce. Those counties post near-full employment and no measured delinquency, so their high scores are a cost-of-living artifact, not a wave of foreclosures. We do not change the weights to hide this, because that would break the method that makes the index comparable across states. Instead we mark the eight resort and second-home counties, Pitkin, Eagle, Routt, Summit, Gunnison, Grand, Garfield, and Teller, with a dagger on the ranked chart and a hatch on the map, and we say clearly that their ranking is about the price of living there, not distress.
Fourth, the index measures leading pressure, not completed foreclosures. Where our scores and realized foreclosure activity disagree, we say so rather than force a match.
Findings
A fast climb from a quiet floor
Colorado is the fastest-rising state in this series, and it is worth being precise about what that means. ATTOM’s mid-year data puts Colorado foreclosure filings up about 57 percent from a year earlier and roughly 121 percent over two years, the steepest two-year increase of any state we have measured. But the starting point was very low. The state ranks only 17th nationally by foreclosure rate, one filing per 657 housing units, and its serious mortgage delinquency rate of 0.7 percent is among the lowest in the country. A number can more than double and still be small. What is happening in Colorado is a Front Range housing market that ran hot for a decade and is now cooling, with payments catching up to families who bought at the top, rather than a broad collapse. That makes the county map more useful than the state headline: the pressure is real, but it is concentrated, and knowing where is the whole value of the exercise.
Two kinds of cost stress
The single most important thing to understand about Colorado’s index is that cost burden, the 30 percent weight, shows up in two completely different kinds of county, and only one of them is distress.
In Pueblo, Fremont, and the fast-growth exurbs, a heavy housing cost burden sits on top of modest local incomes. Families spend too much of what they earn on the mortgage, and when a job wobbles or a rate resets, they fall behind. That is the classic path to foreclosure, and in the counties large enough to report their own delinquency, Pueblo, Weld, and Adams, you can see it turning into actual missed payments.
In the mountain resort counties, a heavy cost burden means something else entirely. Aspen’s Pitkin County, Vail’s Eagle County, Steamboat’s Routt County, Gunnison, Grand, Summit, Garfield’s Roaring Fork valley, and Teller in the mountains west of Colorado Springs all carry cost burdens as high as any in the state, because their housing is extraordinarily expensive relative to the local wage. But these are wealthy, near-fully-employed places: Pitkin and Routt report unemployment near 2.5 percent, and none of them shows any measured rise in delinquency. Their high scores are the arithmetic of expensive real estate, not a sign that owners are losing their homes. This is why both the ranked chart and the heat map flag these eight counties. Read them as the most expensive places to own a home in Colorado, which they are, and not as the most likely places to lose one.
Where the real distress is: Pueblo and the exurbs
Strip out the resort artifact and a clear, smaller map of genuine risk remains. Pueblo County leads it. At 64.1 it is the second-highest score of any ranked county, but unlike the resort towns above it, Pueblo carries the highest measured delinquency in Colorado, 2.0 percent, against a heavy cost burden and lower incomes than the Front Range to its north. Pueblo is the one large Colorado county where every part of the distress picture lines up.
North and east of Denver, the fast-growth exurbs carry the rest of it. Weld County, built around Greeley and the sprawl of new subdivisions along the northern Front Range, grades Elevated at 57.2 with a 1.3 percent delinquency rate. Adams County, home to Aurora’s northern neighborhoods and Commerce City, scores 55.6 with delinquency at 1.1 percent. These are the places where a decade of rapid building and rising home prices outran local incomes, and where the measured evidence of missed payments is now real. Mesa County around Grand Junction on the Western Slope and El Paso County around Colorado Springs round out the large, genuinely pressured counties. A separate, quieter group, Fremont around Cañon City and Delta on the Western Slope, ranks Elevated on a working-class affordability squeeze: high cost burden, modest incomes, but no measured delinquency yet. We would watch those two rather than call them distressed.
The safest ground: the affluent Front Range
The lowest-risk counties in Colorado are the wealthy, high-income core of the Front Range, and the pattern is consistent. Boulder County scores 35.7 with a delinquency rate of just 0.2 percent, the lowest in the state. Douglas County, the affluent suburb between Denver and Colorado Springs, grades Lower at 31.8, and Jefferson County west of Denver sits at 33.4. Larimer County, home to Fort Collins, rounds out the safe tier at 38.9. These counties combine strong incomes, low delinquency, and diversified economies, and even where their housing markets are softening, which shows up as high price-cut shares in Denver, Jefferson, and Douglas, that softening is a cooling market repricing, not owners in trouble. In Colorado, the safest place to hold a mortgage is exactly where the modern economy is densest.
Rate versus volume
Risk per homeowner and total foreclosure volume are different measurements, and Colorado shows both. Adams and El Paso are large counties, each with more than 190,000 housing units, so even a middling rate produces a large raw number of filings, and they are where the biggest volume of distress sits. Pueblo carries the highest risk per homeowner among the large counties, but a smaller population, so its raw counts stay more modest. The resort counties produce very few filings in absolute terms, both because they are small and because, as the index caveat makes clear, their owners are largely not in trouble. For a homeowner weighing their own exposure, the risk index is the relevant number. For anyone sizing the market, volume is, and in Colorado that volume concentrates along the populous northern Front Range.
If you are a Colorado homeowner facing foreclosure
This report is a market analysis, not legal advice, but the data points to a few things worth knowing, and Colorado’s process is unusual enough to explain. Colorado is not a judicial foreclosure state in the ordinary sense, and it is not a pure non-judicial one either. It uses a distinctive system run by the county Public Trustee, an office that exists in every Colorado county. A foreclosure of a deed of trust is administered by that Public Trustee rather than decided by a trial, which makes the process faster and more administrative than the court-driven foreclosures in states like Ohio or Illinois. Sales are typically held on a weekly schedule, often online.
Two features matter most for timing. You hold a right to cure the default, to catch up what you owe and stop the sale, up until roughly 15 days before the sale date. And since 2008, Colorado has ended the post-sale redemption period for owner-occupants, so once the Public Trustee’s sale happens, the window to reclaim the home is effectively closed. The practical takeaway is that the time to act runs before the sale, during the cure window, not after it. Options like reinstatement, a loan modification, or selling the home before the sale can stop the process and limit the damage to your credit, since a foreclosure can remain on a credit report for up to seven years. NestCash works with Colorado homeowners in exactly this situation. Our guide on how to sell a house in foreclosure walks through the timeline and the choices, our Aurora foreclosure guide covers the northern-metro process in detail, and you can start with a cash offer anywhere in the state through our Colorado home-buying page.
The full data
The 26 ranked counties, from highest to lowest Foreclosure Risk Index. An asterisk on the delinquency rate marks a county where the Colorado statewide rate was substituted because the county’s own rate is not separately reported. A dagger marks a resort or second-home county whose Elevated score is driven by housing-cost burden with low unemployment and no measured delinquency, high cost of living rather than foreclosure distress. See Methodology.
| Rank | County | Risk Index | Grade | Price-cut share | Median DOM | Cost burden | 90+ delinquency | Unemployment |
|---|---|---|---|---|---|---|---|---|
| 1 | Teller † | 65.3 | Elevated | 26.8% | 78 | 39.1% | 0.7%* | 3.7% |
| 2 | Pueblo | 64.1 | Elevated | 20.9% | 63 | 32.8% | 2.0% | 4.8% |
| 3 | Gunnison † | 61.2 | Elevated | 17.7% | 67 | 40.9% | 0.7%* | 4.7% |
| 4 | Fremont | 59.3 | Elevated | 21.7% | 69 | 38.4% | 0.7%* | 4.3% |
| 5 | Weld | 57.2 | Elevated | 28.2% | 50 | 32.9% | 1.3% | 4.8% |
| 6 | Grand † | 56.5 | Elevated | 18.2% | 71 | 38.6% | 0.7%* | 4.1% |
| 7 | Adams | 55.6 | Elevated | 29.6% | 51 | 32.9% | 1.1% | 4.6% |
| 8 | Garfield † | 54.5 | Elevated | 20.7% | 73 | 37.7% | 0.7%* | 3.4% |
| 9 | Eagle † | 54.0 | Elevated | 11.9% | 86 | 34.6% | 0.7%* | 4.7% |
| 10 | Mesa | 53.8 | Elevated | 27.2% | 59 | 32.0% | 0.6% | 5.4% |
| 11 | El Paso | 53.1 | Elevated | 31.6% | 50 | 30.2% | 0.8% | 5.4% |
| 12 | Pitkin † | 52.7 | Elevated | 12.0% | 87 | 40.3% | 0.7%* | 2.5% |
| 13 | Routt † | 50.7 | Elevated | 20.0% | 77 | 37.8% | 0.7%* | 2.4% |
| 14 | Delta | 50.6 | Elevated | 24.9% | 69 | 34.8% | 0.7%* | 3.2% |
| 15 | Arapahoe | 49.2 | Moderate | 30.3% | 51 | 29.4% | 0.8% | 5.0% |
| 16 | Denver | 47.2 | Moderate | 30.7% | 58 | 27.9% | 0.6% | 4.9% |
| 17 | Montrose | 46.5 | Moderate | 20.8% | 69 | 30.6% | 0.7%* | 4.4% |
| 18 | Summit † | 46.3 | Moderate | 20.6% | 53 | 32.8% | 0.7%* | 5.0% |
| 19 | Montezuma | 46.1 | Moderate | 26.0% | 65 | 30.3% | 0.7%* | 3.9% |
| 20 | La Plata | 40.2 | Lower | 20.5% | 66 | 29.5% | 0.7%* | 3.8% |
| 21 | Larimer | 38.9 | Lower | 26.6% | 51 | 29.0% | 0.3% | 4.8% |
| 22 | Boulder | 35.7 | Lower | 23.2% | 57 | 27.9% | 0.2% | 4.8% |
| 23 | Park | 34.6 | Lower | 22.1% | 59 | 28.5% | 0.7%* | 3.3% |
| 24 | Jefferson | 33.4 | Lower | 32.1% | 46 | 26.8% | 0.3% | 3.9% |
| 25 | Douglas | 31.8 | Lower | 33.1% | 51 | 24.3% | 0.4% | 3.6% |
| 26 | Broomfield | 29.6 | Lower | 32.6% | 44 | 22.3% | 0.7%* | 3.8% |
What we will watch
We plan to update this index quarterly. Three things will tell us where Colorado goes next: whether the measured delinquency in Pueblo, Weld, and Adams keeps climbing, since that is where the real distress is concentrated and where the next wave would show first; whether the fast statewide rise in filings continues or levels off as the Front Range market finishes repricing; and whether any of the working-class Western Slope counties, Fremont and Delta among them, start to post measured delinquency to match their cost burden. Colorado’s rate is still low and its foreclosure count is still small in absolute terms. The next few quarters will show whether the fastest climb in the country is an early warning or just a market returning to normal from an unusually quiet stretch.
Sources and data
- Foreclosure activity, trend, and national rank. ATTOM Data Solutions, 2026 Mid-Year U.S. Foreclosure Market Report. Used for statewide filing counts, the national rate rank, the one-in-657 figure, and the year-over-year and two-year changes. The 2026 figures are mid-year; the two-year change compares first-half totals.
- Housing market softness. Realtor.com Economic Research, county inventory core metrics through July 2026. Used for the price-cut share, median days on market, and active listing counts.
- Housing, mortgage status, cost burden, and unemployment. U.S. Census Bureau, American Community Survey five-year estimates. Used for county housing counts, the mortgaged-owner universe, housing cost burden, and the unemployment rate.
- Mortgage delinquency. CFPB Mortgage Performance Trends, data through December 2025. Used for the 90-or-more day delinquency rates.
About NestCash
NestCash buys houses for cash in twelve states, including throughout Colorado. We publish original housing research to help homeowners, buyers, and investors understand the markets we work in. This report may be cited and its charts embedded with attribution to NestCash.

John is the Founder of NestCash and a leading voice in real estate investing and housing market strategy. With experience across 12 states, he helps buyers, sellers, and investors make smarter decisions using real-world insight and market data.