

The 2026 Tennessee Foreclosure Risk Index
Where financial pressure on Tennessee homeowners is building, county by county
 Published on July 24th, 2026, by John Carter | Founder, NestCash
Original NestCash research, free to read and cite. If you need to sell a house fast in Tennessee, start here.

Abstract
Tennessee foreclosure activity is rising fast off a historically low base. Filings in the first half of 2026 reached 3,001, up about 24 percent from the same period in 2025, yet the state still ranks 35th of 51 in the country by foreclosure rate. In plain terms, that is a rate of about 0.10 percent of all housing units, one in every 1,048 homes, below the national figure of one in 632 and a small fraction of the 1.65 percent of Tennessee homes, one in 61, that drew a filing at the state’s 2008 crisis peak. One distinction matters before the numbers do any work: a filing marks the start of the legal process, not a completed foreclosure or a home already lost, and most filings are resolved before anyone loses a house. To understand where the rising pressure is concentrated, we built the Tennessee Foreclosure Risk Index, a county-level measure that combines market softness, mortgage cost burden, mortgage delinquency, and unemployment into a single score from 0 to 100. Tennessee’s story is a study in contrasts. The strain is not in the booming middle of the state. It sits in the rural counties of Appalachia and West Tennessee, and in one large metro that has carried housing distress for a generation: Memphis. This report explains the index, ranks all ninety-five counties, and separates two things that are easy to confuse: the risk carried by the average homeowner, and the raw volume of foreclosures a county produces.
We score all ninety-five counties from 0 to 100 by blending four public signals, each weighted by how directly it bears on a mortgaged homeowner: market softness (35 percent), mortgage cost burden (30 percent), 90-day mortgage delinquency (20 percent), and unemployment (15 percent). Each signal is min-max normalized within Tennessee, so the score ranks counties against one another in the state, not against a national or absolute standard. The full weighting, the normalization, and the grade bands are spelled out in the methodology section below.
Key findings
- Tennessee foreclosures are climbing fast, but the rate is low by any standard. First-half 2026 filings totaled 3,001, up 23.9 percent year over year (ATTOM Data Solutions), yet at about 0.10 percent of housing units the state ranks 35th nationally, well below the national rate and a fraction of the 1.65 percent Tennessee saw at its 2008 peak.
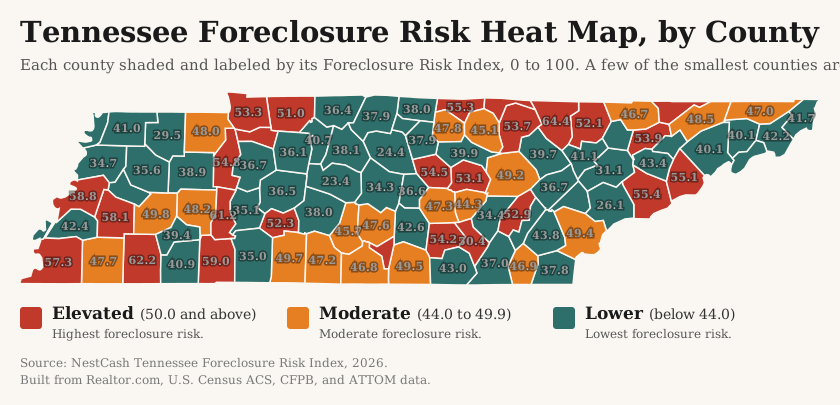
- The pressure is rural, plus Memphis. Twenty-six counties land in the Elevated tier of our index, led by small rural markets, Pickett (71.7), Scott (64.4), Hardeman (62.2), Hancock (61.3), and Decatur (61.2). The one large metro among them is Shelby County (57.3), home to Memphis.
- Booming Middle Tennessee is the safest place in the state. Nashville’s Davidson County scores 38.1, Knoxville’s Knox County 31.1, and the wealthy Nashville suburbs sit at the very bottom, Wilson at 24.4 and Williamson at 23.4, the lowest in the state.
- Our leading indicators line up with the worst realized rates. Two of the counties ATTOM named with Tennessee’s highest June foreclosure rates, Scott and Decatur, both land in our Elevated tier, which raises confidence in both measures.
- Delinquency is low but turning. Tennessee’s serious mortgage delinquency rate (90 or more days past due) sat at 0.8 percent in September 2025, up from 0.6 percent in early 2024 (CFPB). Clarksville’s Montgomery County runs hottest at 1.2 percent, followed by the Tri-Cities and Memphis.
Methodology
Data and sources
We built the index entirely from public and openly licensed data, and we cite each source at the point of use. Market conditions come from Realtor.com Economic Research (county listing data through June 2026). Housing tenure, mortgage status, cost burden, and county housing counts come from the U.S. Census Bureau’s American Community Survey five-year estimates. Mortgage delinquency comes from the Consumer Financial Protection Bureau’s Mortgage Performance Trends (latest data September 2025). Statewide and historical foreclosure trends come from ATTOM Data Solutions’ published foreclosure market reports and the Tennessee Housing Development Agency’s foreclosure trend reports. Every dataset we used is free and publicly available, and every figure in this report traces back to one of the sources above.
Building the index
The Tennessee Foreclosure Risk Index is a weighted blend of four signals, each chosen because it precedes or predicts foreclosure among homeowners who carry a mortgage:
35%
The share of active listings with a price cut and the median days a home sits on the market. A soft market matters because a homeowner in trouble who cannot sell quickly has fewer ways to avoid foreclosure.
30%
The share of owners with a mortgage who spend more than 30 percent of household income on housing. This is direct payment stress on the exact population that can be foreclosed on.
20%
The 90-day-or-more delinquency rate, the clearest early warning that foreclosures are coming.
15%
A secondary driver. We hold its weight down deliberately, because unemployment also captures renters and therefore dilutes a signal meant to describe homeowners.
We normalized each signal across the ninety-five counties on a 0-to-1 scale, where 0 is the lowest value in Tennessee and 1 is the highest, then applied the weights above and multiplied by 100. The result is a relative score: it ranks counties against one another within Tennessee, not against a national or absolute standard. We then graded each county by its score, Elevated for a score of 50 or above, Moderate for 44 to 49.9, and Lower for anything below 44. Twenty-six counties land in the Elevated tier, twenty in Moderate, and forty-nine in Lower.
Limitations
Three limits are worth stating plainly. First, the index is relative. A Lower grade means lower risk than other Tennessee counties, not low risk in absolute terms, and in a state with a foreclosure rate this modest, even the Elevated tier describes pressure rather than crisis. Second, the CFPB reports county delinquency only where a county has at least 1,000 mortgages, so for eighty-three of Tennessee’s ninety-five counties we substituted the statewide delinquency rate. Because that component carries only 20 percent of the weight, the substitution has a modest effect on the rankings. Third, the index measures leading pressure, not completed foreclosures. Where our scores and realized foreclosure rates disagree, we say so rather than force a match.
Findings
The index: pressure at the edges, calm in the middle
Ranked from most to least risk, the index tells a story that runs against the assumption that a state’s housing stress lives in its biggest, fastest-growing cities.
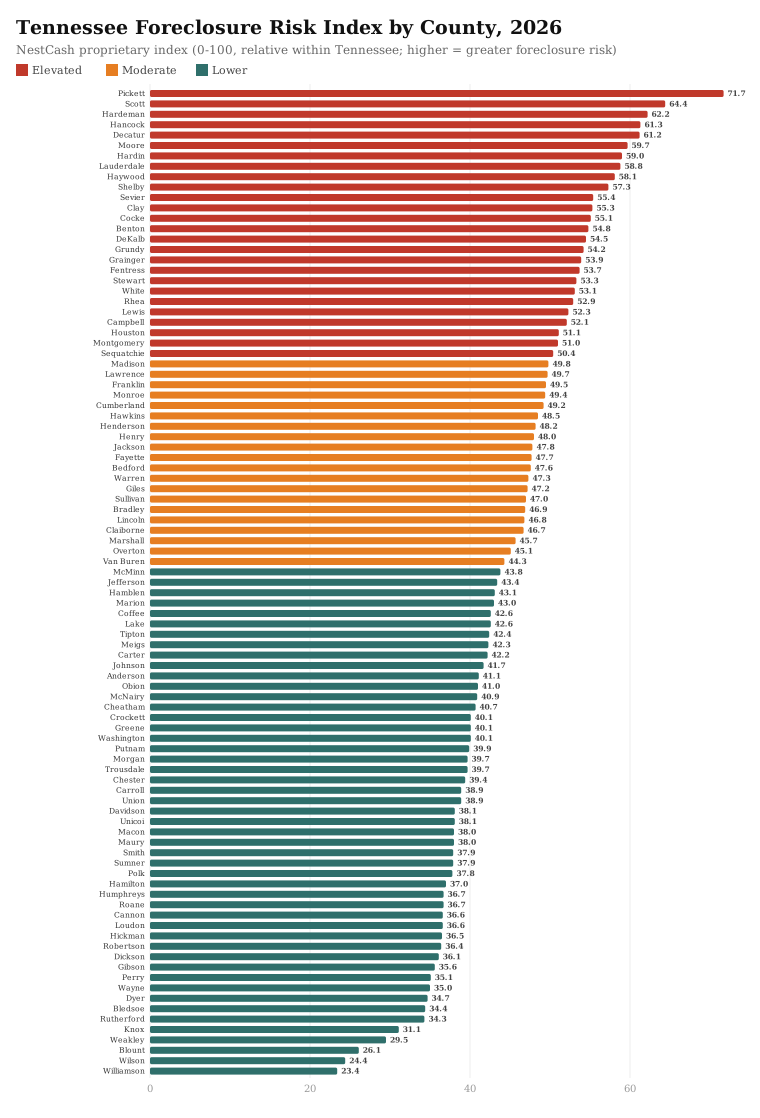
The counties at the top are mostly small and rural, spread across the Cumberland Plateau, Appalachia, and West Tennessee. They share a pattern: modest incomes stretched thin against housing costs, thin and slow resale markets, and weak local job bases. Pickett County tops the list at 71.7 on the strength of the heaviest cost burden in the state, 45.3 percent of its mortgaged owners spending more than 30 percent of income on housing. Scott County follows at 64.4, with the highest share of price-cut listings anywhere in Tennessee, 43.8 percent, and unemployment of 7.5 percent.
At the other end, the Nashville region is the safest ground in the state. Williamson County, the wealthy suburb south of the city, scores 23.4, the lowest in Tennessee, with the state’s lowest serious delinquency rate at 0.2 percent and unemployment of 2.4 percent. Neighboring Wilson County sits just above it. This is the exact inverse of the strained rural counties: steady jobs, deep household balance sheets, and a housing market that still moves.
The counties under the most pressure
Pickett (index 71.7, Elevated). A tiny county on the Kentucky line, Pickett carries the heaviest housing cost burden in Tennessee. When 45.3 percent of mortgaged owners are already spending more than 30 percent of income on housing, a job loss or a medical bill turns into a missed payment faster than it would in a wealthier place. The county holds very few mortgages, so its risk per owner is high while its raw foreclosure count will always be small.
Scott (index 64.4, Elevated). On the Cumberland Plateau, Scott pairs the highest price-cut share in the state (43.8 percent) with a weak job market (7.5 percent unemployment). ATTOM named Scott among Tennessee’s worst counties by realized foreclosure rate in June, so this is a place where the leading pressure and the actual filings agree.
Hardeman, Hancock, and Decatur (index 62.2, 61.3, 61.2, Elevated). These West and East Tennessee rural counties round out the top of the list. Hardeman carries the state’s second-highest unemployment at 9.8 percent. Hancock, in the far northeast, has a slow market at 92 days. Decatur, like Scott, was on ATTOM’s June worst-rate list, and pairs a high cost burden with a soft market.
Shelby (index 57.3, Elevated). Shelby County, home to Memphis, is the one large metro in the Elevated tier, and it is the finding that most defines Tennessee. It carries the highest serious delinquency rate of any major metro county in the state at 1.0 percent, unemployment of 7.2 percent, and a soft market. Memphis has carried housing distress for a generation, and it remains the place where Tennessee’s foreclosure pressure is most concentrated in absolute terms.
Montgomery (index 51.0, Elevated). Clarksville’s county, anchored by Fort Campbell, has the highest serious delinquency rate in the entire state at 1.2 percent. A fast-growing military town with a young, highly mortgaged, and frequently relocating population is a different kind of risk than a hollowed-out rural county, but the payment stress shows up in the same delinquency data.
The metros: Memphis apart, the rest calm
In most of the country, the biggest metros carry either the most risk or the least, and analysts argue about which. Tennessee gives a clear answer, and it splits the metros in two.
On one side sits everything in the booming middle and east of the state. Nashville’s Davidson County (38.1), Knoxville’s Knox County (31.1), Chattanooga’s Hamilton County (37.0), and the Nashville-orbit suburbs of Rutherford, Wilson, and Williamson all grade Lower. Strong job growth, in-migration, and rising incomes have kept their homeowners well ahead of trouble even as prices climbed.
On the other side sits Memphis. Shelby County grades Elevated, alone among the state’s large metros, and it is not close. The reason is not a sudden shock but a long-standing one: a lower-income, heavily mortgaged population, a housing market that has never run as hot as Nashville’s, and delinquency that consistently runs above the state. When people talk about foreclosure risk in Tennessee’s cities, they are, for the most part, talking about Memphis.
Risk versus volume
Risk per homeowner and total foreclosure volume are different measurements, and Tennessee shows why the distinction matters. Shelby and Davidson counties hold far more mortgaged homes than any rural county, so even a modest rate there produces more filings in raw numbers than a high rate in a place like Pickett. Shelby is unusual because it scores high on both: it is a large county and an Elevated one, which is why Memphis dominates the state’s absolute foreclosure activity. For a homeowner weighing their own exposure, the risk index is the relevant number. For anyone sizing the market, volume is. We report both and caution against collapsing them into one claim.
Leading indicators against realized filings
We tested our index against the counties ATTOM named with Tennessee’s highest realized foreclosure rates in June 2026, a short list of small rural counties: Decatur, Carroll, Scott, and Houston. Two of them, Scott and Decatur, land squarely in our Elevated tier, and the others sit in the upper half of the ranking. When a set of leading indicators independently flags the same kinds of places the realized-filing data ranks worst, both measures gain credibility. The pressure our index reads in rural Tennessee is already showing up in completed filings.
What is driving the 2026 rise
Tennessee’s increase is best understood as normalization off an unusually low floor, not the front edge of a crisis.
Foreclosure filings were held down for years by pandemic-era moratoria and forbearance, and by a labor market and housing boom that kept most Tennessee owners comfortably current. As those supports ended and the resale market cooled from its peak, filings began drifting back up. What we are seeing in 2026 is partly that return to normal.
The new strain is concentrated where incomes are thinnest. Serious delinquency has moved from 0.6 percent in early 2024 to 0.8 percent by late 2025, a small absolute change but a clear direction, and it is highest in exactly the places our index flags: Clarksville, the Tri-Cities, and Memphis. Home prices that ran up through the boom remain high relative to rural and working-class incomes, which keeps cost burden elevated in the counties at the top of the list. And mortgage rates that have stayed higher for longer have removed the refinance escape valve that used to let a stretched owner lower a payment.
How today compares to the last crash
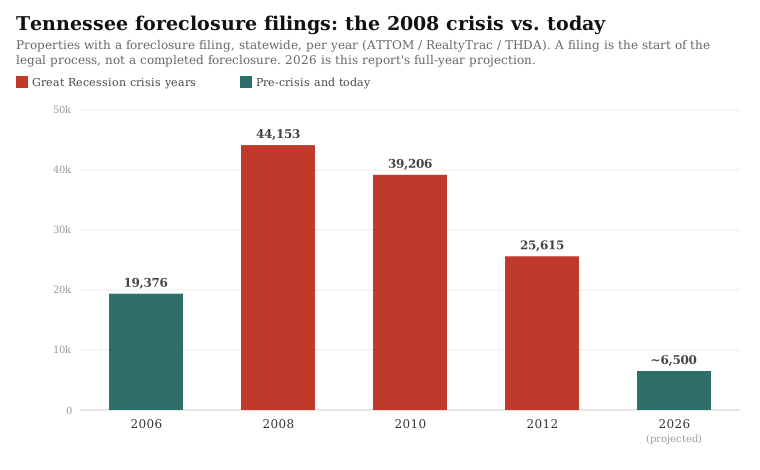
For all the acceleration, it helps to set the 2026 numbers against Tennessee’s own history. At the peak of the last housing crisis the state recorded about 44,153 foreclosure filings in 2008, when roughly one in every 61 Tennessee homes drew a filing. Because Tennessee is a non-judicial state, its foreclosures moved fast, so it peaked early in 2008 and then declined steadily, about 39,000 filings in 2010 and 26,000 in 2012, and it never saw the second-wave, court-backlog spike that hit judicial states like Florida. The 6,000 to 7,000 filings we project for full-year 2026 sit far below any of it, closer to a fraction of the pre-crisis norm than to anything from the crash years.
That is the honest frame for this report. Tennessee’s foreclosure activity is rising, and it is concentrated in identifiable places, but the scale is an affordability squeeze building off a historically low base, not a repeat of 2008. And because a filing is only the start of the legal process, not a home already lost, the counts here describe mounting pressure, not completed foreclosures.
The rest-of-2026 outlook
We offer the following as a projection, not a forecast dressed up as certainty, and we show the method so it can be judged.
Tennessee recorded 3,001 foreclosure filings in the first half of 2026. If the second half simply matches the first, the state finishes the year near 6,000 filings. Because filings have accelerated through recent quarters rather than held flat, and because the underlying pressures, rising delinquency and elevated cost burden in the counties above, point the same direction, we treat 6,000 as a floor. A reasonable range for full-year 2026 is 6,000 to 7,000 filings, which would extend the streak of annual increases while keeping Tennessee below the national foreclosure rate and far below its own history.
Two things temper that. First, the base is very low, and Tennessee is rising off that low floor even as its year-over-year percentage looks large. Second, serious delinquency, the truest early signal, remains below 1 percent statewide. We expect a steady climb through the rest of 2026, concentrated in rural Tennessee, Memphis, and Clarksville, rather than a broad statewide surge.
If you are a Tennessee homeowner facing foreclosure
This report is a market analysis, not legal advice, but the data points to a few things worth knowing, and the most important one is speed. Tennessee is a non-judicial foreclosure state. A lender does not have to take you to court. The process runs on a deed of trust and a trustee’s sale, and once the required notice is published, the timeline to an auction can be short, a matter of weeks rather than the many months a judicial state like Florida gives its owners. That makes acting early far more important here than almost anywhere else.
The window is short, but owners in it generally have more options than they realize: reinstating the loan by catching up on missed payments, negotiating a modification, or selling the home before the trustee’s sale to pay off the balance and protect their credit. A sale ahead of the sale is often the cleanest outcome, because a completed foreclosure stays on a credit report for seven years while a sale does not. NestCash works with Tennessee homeowners in exactly this situation. Our guide on how to sell a house in foreclosure walks through the timeline and the choices in more detail.
The full data
| Rank | County | Risk Index | Grade | Price-cut share | Median DOM | Cost burden | 90+ delinquency | Unemployment |
|---|---|---|---|---|---|---|---|---|
| 1 | Pickett | 71.7 | Elevated | 22.1% | 78 | 45.3% | 0.8%* | 6.8% |
| 2 | Scott | 64.4 | Elevated | 43.8% | 67 | 29.2% | 0.8%* | 7.5% |
| 3 | Hardeman | 62.2 | Elevated | 14.5% | 74 | 34.6% | 0.8%* | 9.8% |
| 4 | Hancock | 61.3 | Elevated | 11.1% | 92 | 33.7% | 0.8%* | 6.3% |
| 5 | Decatur | 61.2 | Elevated | 24.8% | 68 | 35.5% | 0.8%* | 7.2% |
| 6 | Moore | 59.7 | Elevated | 20.8% | 63 | 43.1% | 0.8%* | 4.5% |
| 7 | Hardin | 59.0 | Elevated | 24.2% | 83 | 31.2% | 0.8%* | 4.7% |
| 8 | Lauderdale | 58.8 | Elevated | 18.3% | 86 | 31.0% | 0.8%* | 5.6% |
| 9 | Haywood | 58.1 | Elevated | 25.7% | 82 | 27.6% | 0.8%* | 5.9% |
| 10 | Shelby | 57.3 | Elevated | 25.4% | 64 | 27.9% | 1.0% | 7.2% |
| 11 | Sevier | 55.4 | Elevated | 29.4% | 80 | 28.2% | 0.8%* | 3.3% |
| 12 | Clay | 55.3 | Elevated | 18.8% | 49 | 35.2% | 0.8%* | 10.0% |
| 13 | Cocke | 55.1 | Elevated | 21.5% | 72 | 34.0% | 0.8%* | 4.2% |
| 14 | Benton | 54.8 | Elevated | 22.6% | 73 | 30.5% | 0.8%* | 5.3% |
| 15 | DeKalb | 54.5 | Elevated | 27.0% | 71 | 28.2% | 0.8%* | 5.6% |
| 16 | Grundy | 54.2 | Elevated | 19.8% | 63 | 29.0% | 0.8%* | 9.0% |
| 17 | Grainger | 53.9 | Elevated | 28.2% | 63 | 32.2% | 0.8%* | 4.7% |
| 18 | Fentress | 53.7 | Elevated | 19.4% | 69 | 33.9% | 0.8%* | 4.7% |
| 19 | Stewart | 53.3 | Elevated | 22.6% | 83 | 29.1% | 0.8%* | 2.7% |
| 20 | White | 53.1 | Elevated | 25.6% | 64 | 30.5% | 0.8%* | 5.6% |
| 21 | Rhea | 52.9 | Elevated | 25.5% | 75 | 25.0% | 0.8%* | 5.8% |
| 22 | Lewis | 52.3 | Elevated | 25.2% | 75 | 28.4% | 0.8%* | 3.7% |
| 23 | Campbell | 52.1 | Elevated | 28.6% | 67 | 27.5% | 0.8%* | 5.0% |
| 24 | Houston | 51.1 | Elevated | 19.4% | 79 | 27.8% | 0.8%* | 3.9% |
| 25 | Montgomery | 51.0 | Elevated | 19.0% | 59 | 25.4% | 1.2% | 5.1% |
| 26 | Sequatchie | 50.4 | Elevated | 24.5% | 65 | 25.7% | 0.8%* | 6.6% |
| 27 | Madison | 49.8 | Moderate | 15.5% | 68 | 27.6% | 0.8%* | 7.0% |
| 28 | Lawrence | 49.7 | Moderate | 22.4% | 68 | 27.7% | 0.8%* | 4.9% |
| 29 | Franklin | 49.5 | Moderate | 24.6% | 76 | 26.6% | 0.8%* | 2.8% |
| 30 | Monroe | 49.4 | Moderate | 22.4% | 65 | 29.8% | 0.8%* | 4.3% |
| 31 | Cumberland | 49.2 | Moderate | 22.5% | 66 | 27.7% | 0.8%* | 5.1% |
| 32 | Hawkins | 48.5 | Moderate | 28.7% | 64 | 20.4% | 0.8%* | 7.3% |
| 33 | Henderson | 48.2 | Moderate | 19.1% | 69 | 25.1% | 0.8%* | 6.1% |
| 34 | Henry | 48.0 | Moderate | 15.5% | 68 | 29.6% | 0.8%* | 4.8% |
| 35 | Jackson | 47.8 | Moderate | 22.2% | 61 | 23.8% | 0.8%* | 7.6% |
| 36 | Fayette | 47.7 | Moderate | 22.0% | 70 | 24.9% | 0.8%* | 4.8% |
| 37 | Bedford | 47.6 | Moderate | 20.3% | 68 | 27.7% | 0.8%* | 4.2% |
| 38 | Warren | 47.3 | Moderate | 21.4% | 66 | 24.6% | 0.8%* | 5.9% |
| 39 | Giles | 47.2 | Moderate | 24.1% | 77 | 20.8% | 0.8%* | 4.4% |
| 40 | Sullivan | 47.0 | Moderate | 25.0% | 47 | 24.9% | 1.1% | 5.4% |
| 41 | Bradley | 46.9 | Moderate | 23.2% | 63 | 23.2% | 0.8%* | 6.6% |
| 42 | Lincoln | 46.8 | Moderate | 21.6% | 76 | 21.6% | 0.8%* | 4.7% |
| 43 | Claiborne | 46.7 | Moderate | 28.1% | 60 | 25.6% | 0.8%* | 4.5% |
| 44 | Marshall | 45.7 | Moderate | 21.3% | 69 | 25.1% | 0.8%* | 3.9% |
| 45 | Overton | 45.1 | Moderate | 23.8% | 60 | 28.4% | 0.8%* | 3.2% |
| 46 | Van Buren | 44.3 | Moderate | 16.0% | 71 | 28.3% | 0.8%* | 2.3% |
| 47 | McMinn | 43.8 | Lower | 29.0% | 64 | 19.3% | 0.8%* | 4.9% |
| 48 | Jefferson | 43.4 | Lower | 27.4% | 63 | 20.6% | 0.8%* | 4.6% |
| 49 | Hamblen | 43.1 | Lower | 24.3% | 60 | 22.0% | 0.8%* | 5.3% |
| 50 | Marion | 43.0 | Lower | 15.4% | 69 | 19.1% | 0.8%* | 7.1% |
| 51 | Coffee | 42.6 | Lower | 19.0% | 61 | 26.8% | 0.8%* | 3.6% |
| 52 | Lake | 42.6 | Lower | 24.7% | 62 | 21.0% | 0.8%* | 4.9% |
| 53 | Tipton | 42.4 | Lower | 23.0% | 58 | 22.4% | 0.8%* | 5.5% |
| 54 | Meigs | 42.3 | Lower | 19.7% | 51 | 27.1% | 0.8%* | 5.5% |
| 55 | Carter | 42.2 | Lower | 22.5% | 47 | 26.1% | 0.8%* | 6.2% |
| 56 | Johnson | 41.7 | Lower | 21.4% | 72 | 20.4% | 0.8%* | 3.2% |
| 57 | Anderson | 41.1 | Lower | 27.5% | 52 | 24.6% | 0.8%* | 3.7% |
| 58 | Obion | 41.0 | Lower | 21.1% | 71 | 18.3% | 0.8%* | 4.2% |
| 59 | McNairy | 40.9 | Lower | 16.2% | 66 | 20.0% | 0.8%* | 5.8% |
| 60 | Cheatham | 40.7 | Lower | 20.0% | 65 | 21.1% | 0.8%* | 4.3% |
| 61 | Crockett | 40.1 | Lower | 12.5% | 77 | 21.4% | 0.8%* | 2.9% |
| 62 | Greene | 40.1 | Lower | 18.8% | 57 | 22.0% | 0.8%* | 5.7% |
| 63 | Washington | 40.1 | Lower | 24.1% | 51 | 23.8% | 0.8%* | 4.7% |
| 64 | Putnam | 39.9 | Lower | 24.2% | 54 | 24.0% | 0.8%* | 3.7% |
| 65 | Morgan | 39.7 | Lower | 18.1% | 62 | 20.8% | 0.8%* | 5.1% |
| 66 | Trousdale | 39.7 | Lower | 25.5% | 53 | 29.3% | 0.8%* | 0.6% |
| 67 | Chester | 39.4 | Lower | 17.1% | 68 | 20.1% | 0.8%* | 4.1% |
| 68 | Carroll | 38.9 | Lower | 10.4% | 74 | 19.6% | 0.8%* | 4.5% |
| 69 | Union | 38.9 | Lower | 24.9% | 60 | 21.8% | 0.8%* | 2.6% |
| 70 | Davidson | 38.1 | Lower | 23.1% | 60 | 27.6% | 0.4% | 4.5% |
| 71 | Unicoi | 38.1 | Lower | 23.1% | 51 | 22.7% | 0.8%* | 4.3% |
| 72 | Macon | 38.0 | Lower | 17.3% | 50 | 27.7% | 0.8%* | 3.4% |
| 73 | Maury | 38.0 | Lower | 21.1% | 53 | 28.6% | 0.7% | 2.4% |
| 74 | Smith | 37.9 | Lower | 20.8% | 59 | 23.0% | 0.8%* | 2.7% |
| 75 | Sumner | 37.9 | Lower | 23.4% | 47 | 25.4% | 0.8% | 3.6% |
| 76 | Polk | 37.8 | Lower | 22.3% | 57 | 18.2% | 0.8%* | 5.3% |
| 77 | Hamilton | 37.0 | Lower | 23.9% | 58 | 20.0% | 0.7% | 4.4% |
| 78 | Humphreys | 36.7 | Lower | 17.1% | 51 | 19.4% | 0.8%* | 6.9% |
| 79 | Roane | 36.7 | Lower | 20.4% | 55 | 19.6% | 0.8%* | 4.9% |
| 80 | Cannon | 36.6 | Lower | 12.4% | 59 | 25.7% | 0.8%* | 2.8% |
| 81 | Loudon | 36.6 | Lower | 24.7% | 59 | 19.3% | 0.8%* | 2.8% |
| 82 | Hickman | 36.5 | Lower | 21.3% | 60 | 21.3% | 0.8%* | 2.4% |
| 83 | Robertson | 36.4 | Lower | 21.7% | 49 | 24.2% | 0.8%* | 3.3% |
| 84 | Dickson | 36.1 | Lower | 21.3% | 50 | 23.4% | 0.8%* | 3.4% |
| 85 | Gibson | 35.6 | Lower | 20.9% | 50 | 20.1% | 0.8%* | 5.0% |
| 86 | Perry | 35.1 | Lower | 13.7% | 67 | 14.2% | 0.8%* | 5.8% |
| 87 | Wayne | 35.0 | Lower | 5.0% | 75 | 19.4% | 0.8%* | 3.4% |
| 88 | Dyer | 34.7 | Lower | 14.2% | 66 | 15.9% | 0.8%* | 4.7% |
| 89 | Bledsoe | 34.4 | Lower | 17.4% | 63 | 20.6% | 0.8%* | 1.8% |
| 90 | Rutherford | 34.3 | Lower | 19.5% | 50 | 21.9% | 0.8% | 3.6% |
| 91 | Knox | 31.1 | Lower | 22.8% | 52 | 20.4% | 0.6% | 3.5% |
| 92 | Weakley | 29.5 | Lower | 8.6% | 74 | 10.6% | 0.8%* | 4.0% |
| 93 | Blount | 26.1 | Lower | 19.4% | 53 | 20.6% | 0.4% | 3.5% |
| 94 | Wilson | 24.4 | Lower | 20.0% | 49 | 23.0% | 0.3% | 3.2% |
| 95 | Williamson | 23.4 | Lower | 18.9% | 53 | 24.4% | 0.2% | 2.4% |
*County-level delinquency was unavailable, so the Tennessee statewide rate is used. See Methodology.
What we will watch
We plan to update this index quarterly. Three things will tell us whether Tennessee’s climb is turning into something larger: the serious delinquency rate, which is the earliest honest signal and has already begun to rise, whether the strain stays contained in rural Tennessee, Memphis, and Clarksville or spreads toward the booming middle of the state, and whether the counties where our index runs ahead of realized filings begin to see those filings arrive. Tennessee’s rate is low today. The question the next few quarters will answer is whether it stays that way.
Sources and data
- Foreclosure activity and trend. ATTOM Data Solutions, 2026 Mid-Year U.S. Foreclosure Market Report and Foreclosure Rates by State. Used for statewide filing counts and rates. Historical year-end Tennessee filing totals in the 2006-to-2026 comparison come from ATTOM, its RealtyTrac year-end reports, and the Tennessee Housing Development Agency’s foreclosure trend reports; the 2026 figure is this report’s full-year projection.
- Housing market softness. Realtor.com Economic Research, county inventory core metrics through June 2026. Used for the price-cut share, median days on market, and active listing counts.
- Housing, mortgage status, and cost burden. U.S. Census Bureau, American Community Survey five-year estimates. Used for county housing counts, the mortgaged-owner universe, housing cost burden, and the denominators behind the rates.
- Mortgage delinquency. CFPB Mortgage Performance Trends, data through September 2025. Used for the 30-to-89 day and 90-or-more day delinquency rates.
About NestCash
NestCash buys houses for cash in twelve states, including throughout Tennessee. We publish original housing research to help homeowners, buyers, and investors understand the markets we work in. This report may be cited and its charts embedded with attribution to NestCash.

John is the Founder of NestCash and a leading voice in real estate investing and housing market strategy. With experience across 12 states, he helps buyers, sellers, and investors make smarter decisions using real-world insight and market data.