
The 2026 Virginia Foreclosure
Risk Index
The cities carry the risk, the suburbs carry the homes
 Published on October 31st, 2026, by John Carter | Founder, NestCash
Original NestCash research, free to read and cite.

Abstract
Virginia sits in the middle of the national foreclosure table and is moving with it. In the first half of 2026, 3,741 Virginia properties had a foreclosure filing, one for every 985 housing units, the 31st-highest rate of any state, against a national rate of one in 632. That count was 19 percent higher than in the first half of 2025, while filings nationally rose 21 percent, and 36 percent higher than two years earlier, against 28 percent nationally (ATTOM Data Solutions). The rise has been steady rather than sudden: Virginia’s first-half filings were up 15 percent in 2025 before this year’s 19 percent. At the end of 2025, 0.8 percent of Virginia mortgages were 90 or more days delinquent, against 0.9 percent nationally (Consumer Financial Protection Bureau).
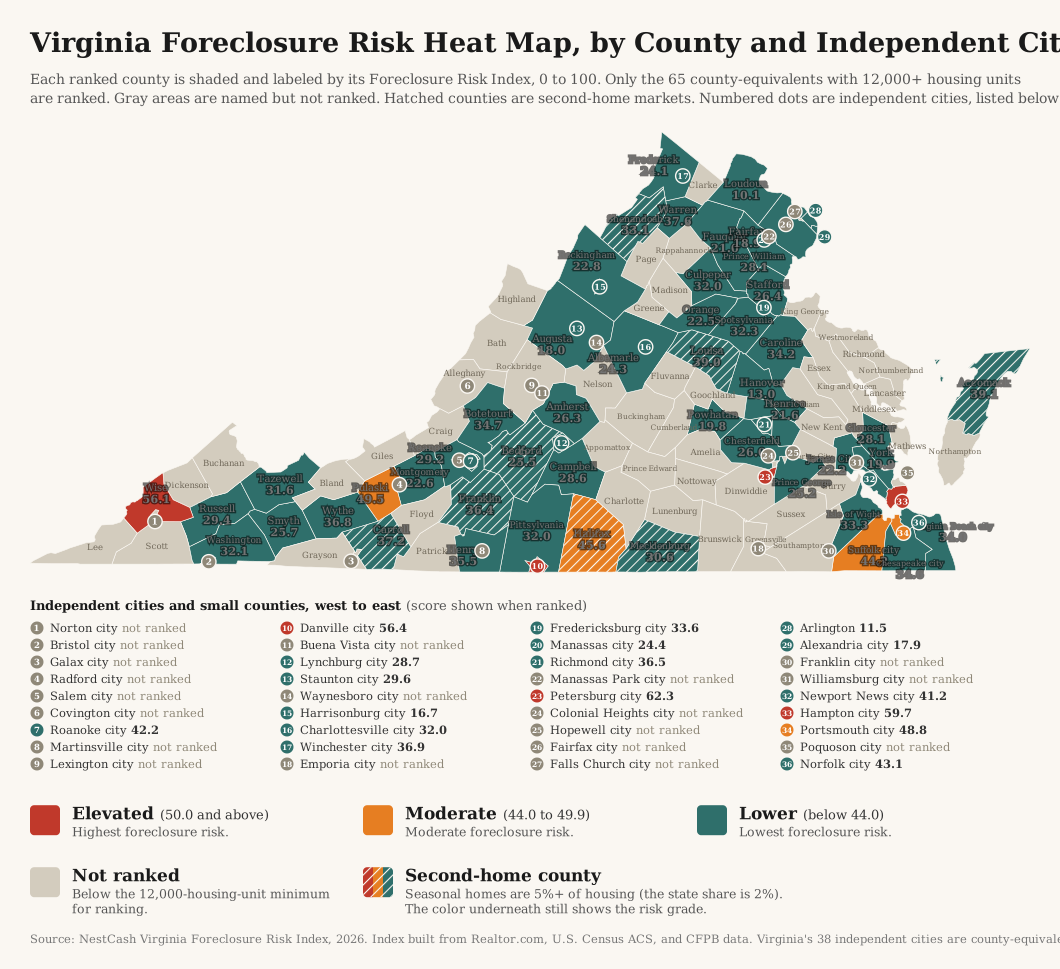
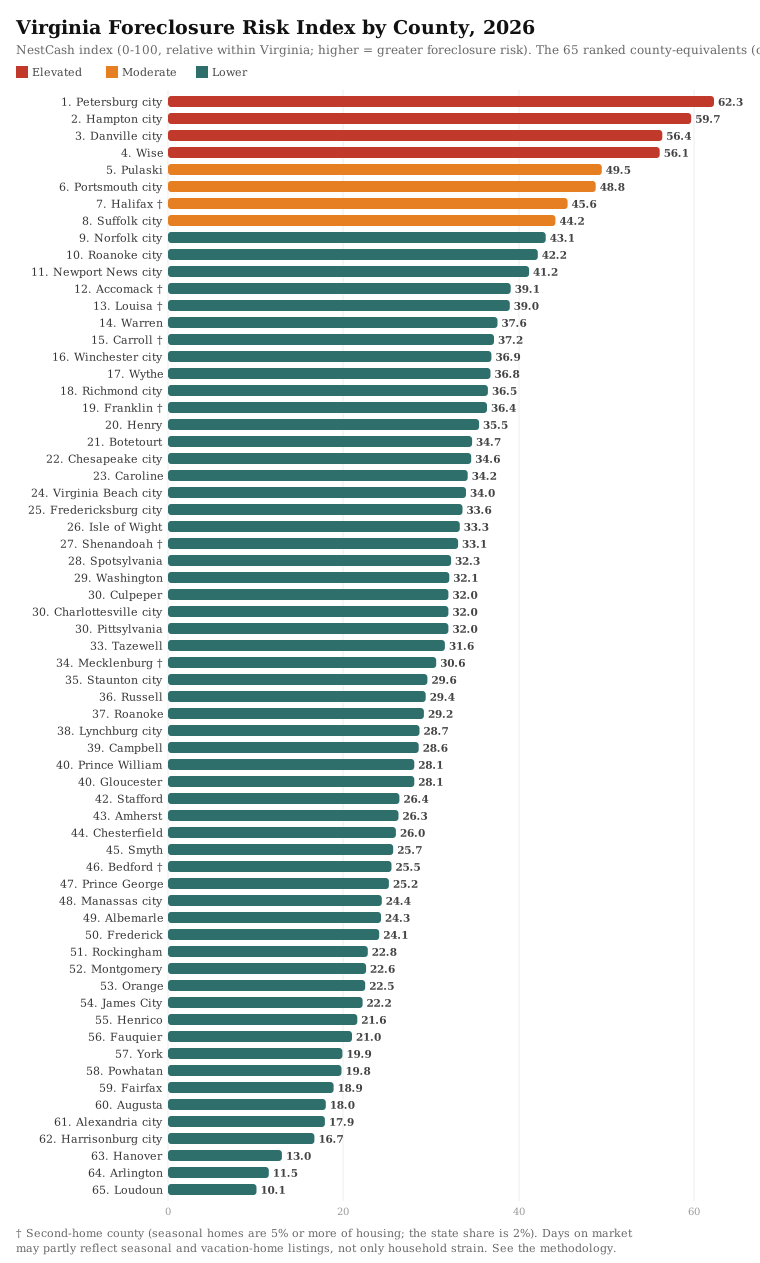
We built a county-level Foreclosure Risk Index from four public datasets to see where that pressure sits. Virginia’s 38 independent cities are county-equivalents, and the index treats them that way, which is why the top of the table looks nothing like the top of the population table. The city of Petersburg, south of Richmond, ranks first at 62.3 and is the only county-equivalent that grades Elevated in every version of the index we tested. Hampton ranks second at 59.7 with the highest published mortgage delinquency rate in the state, 2.2 percent. Danville ranks third at 56.4 and Wise County, in the coalfields of far Southwest Virginia, fourth at 56.1. Those four hold 3.2 percent of the state’s homes. At the other end sit the counties that hold the most: Loudoun County ranks last of 65 at 10.1, Arlington 64th, Hanover 63rd, and Fairfax County, with 430,047 homes, 59th. The four Hampton Roads cities of Hampton, Suffolk, Norfolk, and Newport News carry the four highest published delinquency rates in Virginia. The three Northern Virginia jurisdictions of Loudoun, Arlington, and Fairfax carry the three lowest.
We score each county and independent city from 0 to 100 by blending four public signals, each weighted by how directly it bears on a mortgaged homeowner: market softness (35 percent), mortgage cost burden (30 percent), 90-day mortgage delinquency (20 percent), and unemployment (15 percent). Each signal is min-max normalized within Virginia, so the score ranks county-equivalents against one another in the state, not against a national or absolute standard. A county grades Elevated at 50 or above, Moderate from 44 to 49.9, and Lower below 44. We rank county-equivalents with at least 12,000 housing units, and 65 of Virginia’s 133 clear that floor, 46 counties and 19 independent cities holding 87.1 percent of the state’s homes. Eight ranked counties are second-home markets, and we flag them. We tested the index five different ways and report which findings hold in all of them. The full weighting, the normalization, and the limits of the data are spelled out in the methodology section below.
Key findings
- Virginia is rising with the nation, not ahead of it. The 3,741 properties with a filing in the first half of 2026 were 19 percent more than a year earlier, against a 21 percent national increase, and the state’s rate ranks 31st of 50. Over two years filings are up 36 percent, against 28 percent nationally (ATTOM Data Solutions).
- The risk is in the independent cities, not the big counties. Petersburg, Hampton, and Danville, three cities with 103,000 homes between them, fill three of the four Elevated grades, with Wise County the fourth. The eight jurisdictions with the most homes, led by Fairfax County, Virginia Beach, and Prince William County, all grade Lower, and Loudoun County ranks last.
- Petersburg is the one robust Elevated finding. It is the only county-equivalent that grades Elevated in all five versions of the index, ranking first, second, or third in each. Its homeowners with a mortgage carry the highest cost burden of any ranked county-equivalent, 41.4 percent. Fifty-three county-equivalents grade Lower in all five versions.
- Hampton Roads holds the state’s delinquency. The CFPB publishes a 90-day delinquency rate for 17 Virginia jurisdictions. The four highest are all Hampton Roads cities: Hampton (2.2 percent), Suffolk (1.7), Norfolk (1.3), and Newport News (1.3), each above the national 0.9 percent. The three lowest are Northern Virginia’s Loudoun (0.1), Arlington (0.2), and Fairfax (0.3).
- ATTOM’s county list points the same way. For August 2026, ATTOM listed the cities of Martinsville, Emporia, Petersburg, and Hopewell in its Virginia entry. Petersburg ranks first in our index. The other three are too small to be ranked.
- Virginia forecloses fast. Homes foreclosed in Virginia in the third quarter of 2025 had spent an average of 160 days in the process, the third-shortest timeline of any state, against a national average of 563 days for homes foreclosed in the second quarter of 2026 (ATTOM Data Solutions). The state’s trustee-sale process requires 60 days’ written notice to an owner-occupant before a sale.
You're on the list.
We'll email you when the next report is out. One optional question so we can send the right research:

Methodology
Three limits to read first
We state these before the method because they shape how the Virginia results should be read.
Virginia’s independent cities are counties here. Virginia has 95 counties and 38 independent cities that belong to no county, and the Census Bureau, Realtor.com, the CFPB, and the Bureau of Labor Statistics all report them as county-equivalents. So does this index. That matters for reading the table. A city of 18,075 homes such as Petersburg gets its own row beside Fairfax County’s 430,047, and a city’s score reflects its own residents, not the suburbs around it. Nineteen cities clear the 12,000-housing-unit ranking floor and 19 do not. Bedford, which gave up its city status and rejoined Bedford County in 2013, is counted as part of the county. Where this report says “county,” read “county or independent city.”
Delinquency data for 17 of 65 ranked county-equivalents. The CFPB publishes a 90-day delinquency rate only where a county has enough mortgages in its sample. In Virginia, 17 ranked jurisdictions qualify: Hampton (2.2 percent), Suffolk (1.7), Norfolk (1.3), Newport News (1.3), Spotsylvania (1.1), Chesterfield (1.0), Henrico (1.0), Richmond city (0.9), Virginia Beach (0.9), Stafford (0.9), Chesapeake (0.8), Prince William (0.8), Alexandria (0.4), Hanover (0.4), Fairfax (0.3), Arlington (0.2), and Loudoun (0.1). The other 48, including Petersburg, Danville, and Wise, carry the statewide rate of 0.8 percent. When we remove delinquency from the index, Hampton falls from second to sixth and grades Moderate, and Suffolk falls from eighth to 18th and grades Lower. Every delinquency claim in this report is about published rates only.
Unemployment estimates differ. The index uses the Census five-year unemployment estimate, which covers 2020 to 2024 and includes the pandemic shutdowns. In several Virginia jurisdictions it runs far above the current rate from the Bureau of Labor Statistics: Petersburg 10.0 percent against 5.5 percent, Wise County 8.2 against 4.7, Harrisonburg, home to James Madison University, 6.9 against 4.0, Winchester 6.4 against 3.7, and Portsmouth 6.6 against 4.7. The Petersburg gap is the widest of any ranked county-equivalent. With current unemployment, Petersburg still ranks second and grades Elevated. In a few places the current rate is the higher one: Danville 6.1 percent against 5.6, Tazewell County 5.3 against 3.8, and Smyth County 4.7 against 3.1.
We also flag eight ranked second-home counties. Median days on market is half of the market-softness input, and in second-home markets it is likely inflated by vacation homes that sit longer on the market. Statewide, 2.0 percent of Virginia homes are held for seasonal, recreational, or occasional use, and we flag a county at 5 percent or more, the default rule in this series. Thirty-five of Virginia’s 133 county-equivalents clear it, but only eight ranked ones: Accomack (23.6 percent), Mecklenburg (20.4), Franklin (11.5), Carroll (10.1), Shenandoah (9.9), Louisa (8.8), Halifax (6.3), and Bedford (6.3). Gloucester and Rockingham, at 4.7 percent, are the next ranked counties below the line. None of the four Elevated jurisdictions carries the flag.
We kept the standard formula anyway. Changing the method state by state would break the comparability that makes the series useful, and disclosing where the result is fragile is more useful to readers than tuning it away.
Data and sources
We built the index entirely from public and openly licensed data, and we cite each source at the point of use. Market conditions come from Realtor.com Economic Research (county listing data through September 2026). Housing tenure, mortgage status, cost burden, seasonal homes, county housing counts, and unemployment come from the U.S. Census Bureau’s American Community Survey five-year estimates (2020 to 2024). Mortgage delinquency comes from the Consumer Financial Protection Bureau’s Mortgage Performance Trends (latest data December 2025). Current county unemployment for the sensitivity test comes from the Bureau of Labor Statistics’ Local Area Unemployment Statistics. Statewide filing counts, national ranks, and trends come from ATTOM Data Solutions’ published foreclosure market reports. Every dataset we used is free and publicly available.
Building the index
The Virginia Foreclosure Risk Index uses the same formula as every state in this series, a weighted blend of four signals, each chosen because it precedes or predicts foreclosure among homeowners who carry a mortgage:
35%
The share of active listings with a price cut and the median days a home sits on the market. A soft market matters because a homeowner in trouble who cannot sell quickly has fewer ways to avoid foreclosure. See the note on second-home counties above.
30%
The share of owners with a mortgage who spend 30 percent or more of household income on housing. This is direct payment stress on the exact population that can be foreclosed on.
20%
The 90-day-or-more delinquency rate, the clearest early warning that foreclosures are coming. Published for 17 of the 65 ranked county-equivalents. See the note above.
15%
A secondary driver. We hold its weight down deliberately, because unemployment also captures renters and therefore dilutes a signal meant to describe homeowners.
We ranked the 65 county-equivalents with at least 12,000 housing units. Smaller ones have few listings in a given month, which makes their market data noisy, and the 65 ranked jurisdictions hold 3,208,129 of Virginia’s 3,684,756 homes. We normalized each signal across the ranked set on a 0-to-1 scale, where 0 is the lowest value in that set and 1 is the highest, then applied the weights above and multiplied by 100. The result is a relative score: it ranks Virginia’s counties and cities against one another, not against a national or absolute standard. We then graded each by its score, Elevated for 50.0 or above, Moderate for 44.0 to 49.9, and Lower for anything below 44.0. Four land in the Elevated tier, four in Moderate, and 57 in Lower. The four Elevated jurisdictions hold 3.2 percent of the state’s homes, and the Elevated and Moderate tiers together hold 6.5 percent.
That is an unusually compressed result, and it is worth saying why. Virginia’s lowest-scoring places are very low on every input at once. Loudoun, Arlington, and Fairfax carry published delinquency rates of 0.1 to 0.3 percent, homes there sit on the market a median of 35 or 36 days, and fewer than a quarter of their mortgaged owners carry a high cost burden. Because the index is normalized within the state, those counties set the floor, and most of Virginia sits closer to them than to Petersburg.
To test how much the results depend on any one input, we scored the county-equivalents five ways. The first is the standard index. The second swaps in current Bureau of Labor Statistics unemployment, the 12 published months from September 2025 through September 2026, for the Census five-year estimate. The third removes delinquency and spreads its weight proportionally across the other three signals. The fourth measures market softness by price cuts alone, and the fifth combines price cuts alone with current BLS unemployment. When we call a finding robust in this report, it holds in all five.
Other limitations
The index is relative. A grade describes a jurisdiction’s position among Virginia’s ranked county-equivalents, not its risk in absolute terms. Loudoun County’s score of 10.1 means it sits at or near the low end of the ranked set on every input, not that its homeowners face no risk. The index also measures leading pressure, not completed foreclosures or filings, so it will not match any single month’s filing counts. The 68 county-equivalents below the housing floor are not ranked, and the index says nothing conclusive about them. Several of the small ones would score high on the same formula, led by Rappahannock County at 55.1, the city of Norton at 53.1, Highland County at 52.3, Lancaster County at 51.1, Westmoreland County at 51.0, and Buchanan and Craig counties at 50.4, so every “highest” and “lowest” in this report is a claim about ranked county-equivalents. Those that tie at the published one-decimal score share a rank, as Culpeper, Charlottesville, and Pittsylvania do at 32.0 and Prince William and Gloucester do at 28.1.
Findings
The index
Ranked from most to least risk on the standard formula. Read the daggered second-home counties with the limits above in mind.
Petersburg and the Richmond region
The city of Petersburg, south of Richmond, scores 62.3 and ranks first. Its lead rests on its households, not its sales market. Of its homeowners with a mortgage, 41.4 percent spend 30 percent or more of their income on housing, the highest share of any ranked county-equivalent, and its five-year unemployment estimate, 10.0 percent, is also the highest. Its listings sell more conventionally: 23.4 percent carry a price cut and they sit on the market a median of 50 days, both near the middle of the ranked set. Petersburg’s current unemployment rate is 5.5 percent, far below the five-year figure, but it is still the second-highest current rate of any ranked county-equivalent, and with current unemployment Petersburg ranks second. It ranks first in two versions of the index, second in two, and third in the fifth, and grades Elevated in all five. No other jurisdiction does. ATTOM listed Petersburg in its Virginia entry for August 2026.
The rest of the Richmond region reads very differently. Richmond city ranks 18th at 36.5, with a published delinquency rate of 0.9 percent, the national figure, and listings that sit on the market a median of 39 days. Chesterfield County ranks 44th and Henrico County 55th, each with a published rate of 1.0 percent, slightly above the national rate but paired with short market times and low cost burdens. Hanover County ranks 63rd at 13.0, with a published rate of 0.4 percent and a current unemployment rate of 3.1 percent. Prince George County ranks 47th and Caroline County 23rd. In the Richmond metro area, foreclosures made up 0.2 percent of home listings in Realtor.com’s July 2026 report. For the fourth quarter of 2026, ATTOM listed Richmond city among the Virginia jurisdictions in its zombie-foreclosure entry, in a state where 1.7 percent of homes in foreclosure were vacant, the 45th-highest share of any state.
Hampton Roads
Hampton Roads is where Virginia’s mortgage distress is measurable rather than inferred. The region’s cities account for the four highest published 90-day delinquency rates in the state: Hampton 2.2 percent, Suffolk 1.7, Norfolk 1.3, and Newport News 1.3. The national rate is 0.9 percent. Chesapeake, at 0.8 percent, and Virginia Beach, at 0.9, sit at or just below the national figure.
Hampton ranks second at 59.7. Its delinquency rate is more than twice the national figure, 28.3 percent of its listings carry a price cut, the fifth-highest share of any ranked county-equivalent, and 34.2 percent of its mortgaged owners carry a high cost burden. Hampton ranks first on both versions of the index that measure market softness by price cuts alone, and it grades Elevated in four of the five versions. The exception is the version that removes delinquency, where it falls to sixth and grades Moderate, because its published rate carries part of its score. Portsmouth ranks sixth at 48.8 and grades Moderate. Its cost burden, 40.1 percent, is the second-highest of any ranked county-equivalent, but its listings sit on the market a median of 35 days, tied for the shortest time in the ranked set, which holds its score down. Portsmouth grades Elevated in three versions, including both price-cut versions.
Suffolk ranks eighth at 44.2, the lowest Moderate score, and its position depends on its published 1.7 percent delinquency rate: without delinquency it falls to 18th and grades Lower. Norfolk ranks ninth at 43.1 and Newport News 11th at 41.2. Both grade Lower on the standard index and Moderate on the two price-cut versions. Chesapeake ranks 22nd and Virginia Beach, the state’s second-largest jurisdiction with 191,294 homes, 24th at 34.0. Isle of Wight County ranks 26th, Gloucester County 40th, James City County 54th, and York County 57th, with the lowest cost burden of any ranked county-equivalent, 17.1 percent. In the Virginia Beach-Chesapeake-Norfolk metro area, foreclosures made up 0.6 percent of home listings in Realtor.com’s July 2026 report.
One national factor may bear on the region. VA-backed loans lost their main rescue program in 2025, and more than 10,000 veterans nationally lost their homes to foreclosure between May 2025, when the Department of Veterans Affairs ended its Servicing Purchase program, and April 2026, the highest pace of VA-loan foreclosures in a decade, and another 90,000 were headed toward foreclosure (NPR, carried in Virginia by VPM). No source we found breaks those figures out for Hampton Roads, so we report the national numbers and the local delinquency rates side by side without joining them.
Southside and the coalfields
Danville, on the North Carolina line, ranks third at 56.4. Its listings sit on the market a median of 99 days, the longest of any ranked county-equivalent, and 36.5 percent of its mortgaged owners carry a high cost burden, the third-highest share. Its current unemployment rate, 6.1 percent, is the highest current rate of any ranked county-equivalent, and with current unemployment Danville ranks first. But only 15.9 percent of its listings carry a price cut, among the lowest shares of any ranked county-equivalent, and on the version that measures softness by price cuts alone Danville falls to 13th and grades Lower. It grades Elevated in three of five versions. The score describes strained households after decades of job losses in tobacco and textiles, not a shrinking city: Danville has added more than 100 housing units since 2023 with more than 200 under construction, and the city’s housing director put pent-up demand at nearly 4,000 rental units and 1,300 owned units as a data center and a battery manufacturer are expected to bring jobs to the region (Cardinal News). Pittsylvania County, which surrounds Danville, ranks 30th and grades Lower.
Wise County, in the coalfields of far Southwest Virginia, ranks fourth at 56.1. It is above the middle of the ranked set on every measured input: 28.7 percent of its listings carry a price cut, the fourth-highest share, its listings sit on the market a median of 86 days, the fourth-longest, and its five-year unemployment estimate, 8.2 percent, is the second-highest. Its current rate is 4.7 percent. Wise grades Elevated in four versions and Moderate on the fifth. The region around it is losing people. Virginia’s seven coalfield counties lost 7,208 residents between the 2020 census and the July 2025 estimate, a 4.0 percent decline, and the Weldon Cooper Center’s 2025 projections have Wise County losing 30 percent of its population by 2050 (U.S. Census Bureau Vintage 2025 estimates, via Cardinal News). Tazewell County ranks 33rd and Russell County 36th, both Lower. Buchanan and Dickenson counties are too small to be ranked.
Halifax County, home to South Boston, ranks seventh at 45.6 and grades Moderate. Its cost burden, 34.5 percent, is the fourth-highest of any ranked county-equivalent, and 6.3 percent of its homes are seasonal, so it carries the second-home flag. It grades Elevated with current unemployment and Lower on both price-cut versions. Henry County, which surrounds Martinsville, ranks 20th. Mecklenburg County ranks 34th, with the second-longest market time in the state, 98 days, but the third-lowest price-cut share, 13.4 percent, and 20.4 percent of its homes seasonal, the second-highest share of any ranked county. ATTOM listed the cities of Martinsville and Emporia, both too small to be ranked, in its Virginia entry for August 2026.
Roanoke, the New River Valley, and the Shenandoah Valley
Pulaski County ranks fifth at 49.5, the highest Moderate score, and its signal is the sales market: 41.5 percent of its active listings carry a price cut, the highest share of any ranked county-equivalent by a wide margin, and they sit on the market a median of 71 days. Its unemployment is low, and its cost burden sits in the upper half of the ranked set. Pulaski grades Elevated in four of the five versions, every one but the standard index, and ranks second when price cuts are combined with current unemployment. The county’s largest manufacturing employer, the Volvo Trucks plant in Dublin, rehired between 50 and 70 workers in early 2026 after laying off between 500 and 700 a year earlier (The Roanoke Times).
Roanoke city ranks tenth at 42.2, grading Lower, and Moderate when delinquency is removed. Roanoke County ranks 37th, with the third-highest price-cut share, 29.6 percent, and Botetourt County 21st, with the second-highest, 36.9 percent. Montgomery County, home to Virginia Tech, ranks 52nd. Franklin County ranks 19th, and Bedford County 46th, both second-home counties on the Smith Mountain Lake shoreline at 11.5 and 6.3 percent seasonal. Lynchburg ranks 38th, Amherst County 43rd, and Campbell County 39th. Carroll County, on the Blue Ridge, ranks 15th and carries the second-home flag at 10.1 percent, and Wythe County ranks 17th with the sixth-highest price-cut share, 27.9 percent, tied with Russell County.
In the Shenandoah Valley, Warren County ranks 14th at 37.6 and Winchester 16th at 36.9, each Lower. Winchester’s five-year unemployment estimate, 6.4 percent, is the fifth-highest of any ranked county-equivalent, but its current rate is 3.7. Shenandoah County ranks 27th and is a second-home county at 9.9 percent. Harrisonburg ranks 62nd at 16.7 despite the third-highest five-year unemployment estimate, 6.9 percent. The city is home to James Madison University, its current rate is 4.0 percent, and among ranked county-equivalents it has the lowest price-cut share, 12.6 percent, the shortest market time, 35 days, tied with three others, and the second-lowest cost burden, 18.0 percent. Rockingham County ranks 51st, Augusta County 60th, Staunton 35th, Charlottesville 30th, and Albemarle County 49th.
Northern Virginia
Northern Virginia holds the bottom of the table. Loudoun County ranks last of 65 at 10.1, Arlington County 64th at 11.5, Alexandria 61st at 17.9, and Fairfax County 59th at 18.9. All four grade Lower in every version of the index. Their published 90-day delinquency rates, 0.1, 0.2, 0.4, and 0.3 percent, are the lowest published rates in Virginia, with Alexandria tied with Hanover County at 0.4, and their listings sit on the market a median of 35 to 38 days. Fauquier County ranks 56th, Manassas 48th, Stafford County 42nd, and Prince William County 40th, with a published delinquency rate of 0.8 percent. Spotsylvania County ranks 28th with a published rate of 1.1 percent, above the national figure, and Fredericksburg 25th.
The region’s labor market weakened in 2025 and 2026 without yet showing up in these mortgage figures. Job totals across the Washington region fell nearly 1.7 percent in the year to December 2025, the largest decline of any major metropolitan area, with about 54,000 of the roughly 56,000 lost jobs stemming directly from federal layoffs, and unemployment rose in every suburban Virginia county in the region (Brookings Metro). Jobs located in Fairfax County fell 2.1 percent in the year to the first quarter of 2026, Arlington’s fell 4.5 percent, and Alexandria’s 2.6 percent, while Loudoun’s rose 2.8 percent and Prince William’s 1 percent (FFXnow, from Bureau of Labor Statistics data). The University of Virginia’s Weldon Cooper Center projected in September 2026 that Virginia would lose about 18,050 jobs in 2026, a second straight year of contraction, with unemployment holding near 3.9 percent (FFXnow). Active listings in Northern Virginia rose faster than elsewhere in the Mid-Atlantic while home prices held steady (Arlington Magazine, May 2026). The delinquency figures in this index run through December 2025. The Washington-Arlington-Alexandria metro area, which spans the District, Maryland, Northern Virginia, and a corner of West Virginia, had 285 foreclosure listings as of June 2026, and foreclosures made up 1.9 percent of its listings in Realtor.com’s July 2026 report. We would not read that as a Northern Virginia number: the index places every Northern Virginia jurisdiction in the Lower tier.
The Eastern Shore and the lake counties
Accomack County, on the Eastern Shore, ranks 12th at 39.1 and is the state’s clearest second-home market: 23.6 percent of its homes are held for seasonal use, the highest share of any ranked county. Its listings sit on the market a median of 88 days, the third-longest, which carries its score, but only 14.3 percent carry a price cut, and on the version that measures softness by price cuts alone Accomack falls to 44th. We report its rank and would not build a story on it. Louisa County, which includes much of Lake Anna, ranks 13th and carries the flag at 8.8 percent. Together with Mecklenburg, Franklin, Carroll, Shenandoah, Halifax, and Bedford, those are the eight ranked second-home counties, and none of them grades Elevated.
How today compares with the last crisis
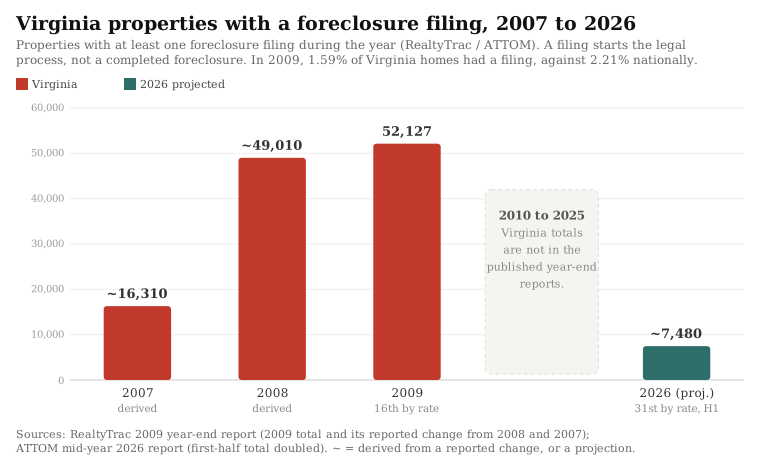
In 2009, 52,127 Virginia properties had a foreclosure filing, 1.59 percent of the state’s housing units, against 2.21 percent nationally. That rate ranked Virginia 16th among the states (RealtyTrac). The published year-end reports we hold do not give Virginia’s totals for 2010 through 2025, so the chart shows those years as a gap rather than estimating them. What they do show is that Virginia’s process stayed fast. Virginia had one of the shortest average foreclosure timelines in the nation at the end of 2012 (146 days), in 2013 (198 days), at the end of 2015 (225 days), and at the end of 2016, when its 223 days was the shortest of any state (RealtyTrac and ATTOM Data Solutions). It was 160 days for homes foreclosed in the third quarter of 2025, the third-shortest of any state. Virginia was also one of 16 states where foreclosure starts rose in 2015, up 23 percent, and one of 21 states where bank repossessions rose in 2016, up 9 percent, both against falling national counts. At its first-half pace, Virginia is on track for about 7,480 properties with a filing in 2026, about 0.20 percent of its housing units, against about 0.32 percent nationally. That is about a seventh of the 2009 count.
How Virginia compares with its neighbors
In the first half of 2026, Virginia’s foreclosure rate was one in 985 housing units (ATTOM Data Solutions). That was lower than in Maryland, where Baltimore City ranks first in our county index (one in 514) and North Carolina, where our county index puts Scotland County first (one in 581). It was the same as in Kentucky, where Knox County leads our county index (one in 985). It was higher than in Tennessee, where Pickett County ranks first in our county index (one in 1,048).
If you are a Virginia homeowner facing foreclosure
This report is a market analysis, not legal advice, but the data points to a few things worth knowing. Virginia is a non-judicial foreclosure state: a home financed with a deed of trust can be sold by a trustee without a court case once the borrower defaults (Va. Code § 55.1-320). The protection built into that process is notice. For an owner-occupied home, the trustee or lender must mail the owner written notice of the time, date, and place of the sale no less than 60 days before it, by certified or registered mail. For other deeds of trust the period is 14 days (Va. Code § 55.1-321). That notice to an owner-occupant must include the date and amount of the last payment received, the total arrears, and the remaining principal balance, along with the HUD housing-counseling website, the statewide legal aid center’s website and phone number, and this statement in at least 12-point type: “This is NOT a notice to vacate the premises. You should consider contacting an attorney or your local legal aid or housing counseling agency.” The sale cannot go forward unless the trustee has proof the notice was sent, and for an owner-occupied home the trustee must hold a signed affidavit confirming it (Va. Code § 55.1-320). A defect in that notice does not void a completed sale, so the time to act is before the sale, not after it (Va. Code § 55.1-321, subsection C). The sale must also be advertised in a local newspaper, once a week for four weeks unless the deed of trust says otherwise, or on five days in or next to a city, and it must be held between eight days after the first advertisement and 30 days after the last (Va. Code § 55.1-322). Because Virginia’s process is among the fastest in the country, the 60 days after that notice are the window that matters. Use them.
Help is available. Virginia Housing, the state’s housing finance agency, advises homeowners who expect trouble not to wait until a payment is missed, and links to HUD’s list of approved housing counselors in Virginia. Its toll-free line is 877-843-2123. The Virginia Poverty Law Center runs a statewide helpline at 1-800-868-8752, and the statewide legal aid intake line is 866-534-5243, with a guide to free civil legal help at VirginiaLawHelp.org. A HUD-approved housing counselor can also review your options: call (800) 569-4287 to find one near you (HUD).
The full data
The 65 ranked county-equivalents, from highest to lowest Foreclosure Risk Index. Independent cities carry “city” after their name, as the Census Bureau writes them. An asterisk on the delinquency rate marks a jurisdiction where the Virginia statewide rate was substituted because its own rate is not separately reported. A dagger marks a second-home county, where seasonal homes are 5 percent or more of housing. Unemployment is the five-year Census estimate used in the index. Jurisdictions that tie at the published score share a rank.
| Rank | County | FRI | Grade | Price cuts | Median DOM | Cost burden | 90+ delinq | Unemployment |
|---|---|---|---|---|---|---|---|---|
| 1 | Petersburg city | 62.3 | Elevated | 23.4% | 50 | 41.4% | 0.8*% | 10.0% |
| 2 | Hampton city | 59.7 | Elevated | 28.3% | 40 | 34.2% | 2.2% | 6.3% |
| 3 | Danville city | 56.4 | Elevated | 15.9% | 99 | 36.5% | 0.8*% | 5.6% |
| 4 | Wise | 56.1 | Elevated | 28.7% | 86 | 28.7% | 0.8*% | 8.2% |
| 5 | Pulaski | 49.5 | Moderate | 41.5% | 71 | 28.4% | 0.8*% | 3.2% |
| 6 | Portsmouth city | 48.8 | Moderate | 21.6% | 35 | 40.1% | 0.8*% | 6.6% |
| 7 | Halifax † | 45.6 | Moderate | 17.5% | 75 | 34.5% | 0.8*% | 4.2% |
| 8 | Suffolk city | 44.2 | Moderate | 22.5% | 48 | 28.7% | 1.7% | 5.0% |
| 9 | Norfolk city | 43.1 | Lower | 23.5% | 42 | 30.6% | 1.3% | 5.7% |
| 10 | Roanoke city | 42.2 | Lower | 25.5% | 64 | 28.0% | 0.8*% | 5.6% |
| 11 | Newport News city | 41.2 | Lower | 27.5% | 44 | 26.5% | 1.3% | 5.8% |
| 12 | Accomack † | 39.1 | Lower | 14.3% | 88 | 29.2% | 0.8*% | 3.4% |
| 13 | Louisa † | 39.0 | Lower | 21.3% | 73 | 25.2% | 0.8*% | 5.8% |
| 14 | Warren | 37.6 | Lower | 24.6% | 44 | 30.3% | 0.8*% | 4.9% |
| 15 | Carroll † | 37.2 | Lower | 19.4% | 79 | 23.8% | 0.8*% | 5.5% |
| 16 | Winchester city | 36.9 | Lower | 21.8% | 48 | 27.8% | 0.8*% | 6.4% |
| 17 | Wythe | 36.8 | Lower | 27.9% | 79 | 21.7% | 0.8*% | 4.0% |
| 18 | Richmond city | 36.5 | Lower | 22.4% | 39 | 29.5% | 0.9% | 5.7% |
| 19 | Franklin † | 36.4 | Lower | 25.0% | 71 | 27.1% | 0.8*% | 2.4% |
| 20 | Henry | 35.5 | Lower | 23.9% | 71 | 24.2% | 0.8*% | 4.1% |
| 21 | Botetourt | 34.7 | Lower | 36.9% | 61 | 22.1% | 0.8*% | 2.4% |
| 22 | Chesapeake city | 34.6 | Lower | 25.1% | 40 | 28.5% | 0.8% | 4.9% |
| 23 | Caroline | 34.2 | Lower | 21.2% | 47 | 27.9% | 0.8*% | 5.3% |
| 24 | Virginia Beach city | 34.0 | Lower | 21.9% | 37 | 30.9% | 0.9% | 4.0% |
| 25 | Fredericksburg city | 33.6 | Lower | 26.7% | 54 | 23.5% | 0.8*% | 5.1% |
| 26 | Isle of Wight | 33.3 | Lower | 20.8% | 53 | 28.3% | 0.8*% | 3.9% |
| 27 | Shenandoah † | 33.1 | Lower | 18.4% | 56 | 27.2% | 0.8*% | 4.8% |
| 28 | Spotsylvania | 32.3 | Lower | 24.7% | 45 | 23.1% | 1.1% | 5.1% |
| 29 | Washington | 32.1 | Lower | 26.4% | 72 | 21.8% | 0.8*% | 3.0% |
| 30 | Culpeper | 32.0 | Lower | 23.2% | 58 | 27.0% | 0.8*% | 2.6% |
| 30 | Charlottesville city | 32.0 | Lower | 23.3% | 52 | 26.5% | 0.8*% | 3.7% |
| 30 | Pittsylvania | 32.0 | Lower | 15.9% | 67 | 25.2% | 0.8*% | 4.7% |
| 33 | Tazewell | 31.6 | Lower | 18.7% | 63 | 25.9% | 0.8*% | 3.8% |
| 34 | Mecklenburg † | 30.6 | Lower | 13.4% | 98 | 21.8% | 0.8*% | 2.6% |
| 35 | Staunton city | 29.6 | Lower | 15.1% | 50 | 26.5% | 0.8*% | 5.3% |
| 36 | Russell | 29.4 | Lower | 27.9% | 66 | 19.2% | 0.8*% | 3.6% |
| 37 | Roanoke | 29.2 | Lower | 29.6% | 61 | 20.6% | 0.8*% | 2.8% |
| 38 | Lynchburg city | 28.7 | Lower | 22.6% | 48 | 22.5% | 0.8*% | 5.3% |
| 39 | Campbell | 28.6 | Lower | 21.8% | 61 | 22.5% | 0.8*% | 3.7% |
| 40 | Prince William | 28.1 | Lower | 22.1% | 35 | 26.0% | 0.8% | 4.8% |
| 40 | Gloucester | 28.1 | Lower | 18.8% | 48 | 27.6% | 0.8*% | 3.0% |
| 42 | Stafford | 26.4 | Lower | 25.5% | 44 | 21.9% | 0.9% | 3.7% |
| 43 | Amherst | 26.3 | Lower | 14.0% | 60 | 23.1% | 0.8*% | 4.7% |
| 44 | Chesterfield | 26.0 | Lower | 18.9% | 40 | 23.5% | 1.0% | 4.6% |
| 45 | Smyth | 25.7 | Lower | 16.6% | 70 | 21.7% | 0.8*% | 3.1% |
| 46 | Bedford † | 25.5 | Lower | 19.0% | 66 | 21.2% | 0.8*% | 3.1% |
| 47 | Prince George | 25.2 | Lower | 13.0% | 56 | 22.8% | 0.8*% | 5.2% |
| 48 | Manassas city | 24.4 | Lower | 23.5% | 37 | 23.4% | 0.8*% | 3.8% |
| 49 | Albemarle | 24.3 | Lower | 14.2% | 58 | 23.9% | 0.8*% | 3.4% |
| 50 | Frederick | 24.1 | Lower | 24.8% | 42 | 20.8% | 0.8*% | 4.2% |
| 51 | Rockingham | 22.8 | Lower | 20.5% | 59 | 20.5% | 0.8*% | 2.7% |
| 52 | Montgomery | 22.6 | Lower | 20.2% | 65 | 18.8% | 0.8*% | 2.9% |
| 53 | Orange | 22.5 | Lower | 24.1% | 52 | 18.9% | 0.8*% | 3.4% |
| 54 | James City | 22.2 | Lower | 18.1% | 46 | 24.1% | 0.8*% | 2.7% |
| 55 | Henrico | 21.6 | Lower | 16.1% | 38 | 22.9% | 1.0% | 3.9% |
| 56 | Fauquier | 21.0 | Lower | 20.7% | 38 | 23.3% | 0.8*% | 2.9% |
| 57 | York | 19.9 | Lower | 25.4% | 42 | 17.1% | 0.8*% | 4.2% |
| 58 | Powhatan | 19.8 | Lower | 16.9% | 51 | 20.2% | 0.8*% | 3.6% |
| 59 | Fairfax | 18.9 | Lower | 20.2% | 36 | 24.0% | 0.3% | 4.2% |
| 60 | Augusta | 18.0 | Lower | 19.2% | 40 | 21.9% | 0.8*% | 2.4% |
| 61 | Alexandria city | 17.9 | Lower | 20.9% | 38 | 23.1% | 0.4% | 3.3% |
| 62 | Harrisonburg city | 16.7 | Lower | 12.6% | 35 | 18.0% | 0.8*% | 6.9% |
| 63 | Hanover | 13.0 | Lower | 16.3% | 50 | 19.7% | 0.4% | 2.7% |
| 64 | Arlington | 11.5 | Lower | 17.5% | 36 | 21.6% | 0.2% | 3.3% |
| 65 | Loudoun | 10.1 | Lower | 21.5% | 35 | 19.5% | 0.1% | 3.3% |
What we will watch
We plan to update this index quarterly, beginning with the first quarter of 2027. Three things will tell us where Virginia goes from here. The first is the filing trend: first-half filings rose 15 percent in 2025 and 19 percent in 2026, and the question is whether that steady climb continues or breaks either way. The second is Hampton Roads delinquency, whether the four cities already above the national rate pull further away and whether the national VA-loan trend shows up there. The third is Northern Virginia, where the federal job losses of 2025 and 2026 had not reached the December 2025 delinquency figures, and where the next CFPB release will show whether Loudoun’s 0.1 percent and Arlington’s 0.2 percent hold.
Sources and data
- Foreclosure activity and trend. ATTOM Data Solutions, 2026 Mid-Year U.S. Foreclosure Market Report (published July 16, 2026), Mid-Year 2025 U.S. Foreclosure Market Report (July 2025), Q3 2025 U.S. Foreclosure Market Report (October 2025), U.S. Foreclosure Rates by State, August 2026 (published September 18, 2026), and Zombie Foreclosure Rates by State, Q4 2026 (published October 30, 2026). Used for statewide filing counts, the national rank, the one-year and two-year changes, the foreclosure timeline, the counties listed for August filings, and the zombie-foreclosure share.
- Historical record. RealtyTrac, 2009 Year-End Foreclosure Market Report (via the Financial Crisis Inquiry Commission archive), and the RealtyTrac and ATTOM year-end foreclosure market reports for 2012, 2013, 2015, and 2016. Used for the 2009 total, rate, and rank, the foreclosure timelines, and the 2015 and 2016 changes.
- Housing market softness. Realtor.com Economic Research, county inventory core metrics through September 2026, and Foreclosures Are Ticking Up (July 7, 2026), for the foreclosure share of listings in the Richmond, Virginia Beach, and Washington metro areas.
- Housing, mortgage status, cost burden, seasonal homes, and unemployment. U.S. Census Bureau, American Community Survey five-year estimates, 2020 to 2024, and the Census Bureau’s definition of county-equivalent entities.
- Current unemployment. U.S. Bureau of Labor Statistics, Local Area Unemployment Statistics, the 12 published months from September 2025 through September 2026 (BLS published no October 2025 figures). Used for the sensitivity test and the current-rate comparisons.
- Mortgage delinquency. CFPB Mortgage Performance Trends, state and county data through December 2025. Used for the 90-or-more day delinquency rates and the national comparison.
- Local context. Brookings Metro, After the “fork”: Greater Washington leads the nation in regional job loss (March 5, 2026), FFXnow, Hiring sluggish in Va., with Fairfax employment down 2.1% since Trump’s return to office (September 2, 2026), Arlington Magazine, Did DOGE Cripple Northern Virginia’s Housing Market? (May 7, 2026), The Roanoke Times, Volvo plant in Dublin conducts limited rehiring after hundreds laid off last year (February 18, 2026), Cardinal News, Jobs to be created by large data center and battery manufacturer upping Danville region’s housing needs (October 13, 2026) and Virginia’s coalfields are losing the race against time (April 3, 2026), and NPR, Trump’s VA killed a home loan program. Vets are now losing their homes because of it (April 2, 2026), carried by VPM.
- Foreclosure process. Code of Virginia § 55.1-320, § 55.1-321, and § 55.1-322. Help resources from Virginia Housing, the Virginia Poverty Law Center, Virginia Law Help, and HUD.
About NestCash
NestCash buys houses for cash in twelve states and publishes original housing and distressed-property research across U.S. markets. Our original housing research helps homeowners, buyers, and investors understand local market conditions. This report may be cited and its charts embedded with attribution to NestCash.

John is the Founder of NestCash and a leading voice in real estate investing and housing market strategy. With experience across 12 states, he helps buyers, sellers, and investors make smarter decisions using real-world insight and market data.
You're on the list.
We'll email you when the next report is out. One optional question so we can send the right research: