
The 2026 North Carolina Foreclosure Risk Index
Where financial pressure on North Carolina homeowners is building, county by county
 Published on September 23rd, 2026, by John Carter | Founder, NestCash
Original NestCash research, free to read and cite. If you need to sell a house fast in North Carolina, start here.

Abstract
North Carolina’s foreclosure activity is climbing faster than almost anywhere. Filings reached 8,429 in the first half of 2026, one for every 581 housing units, up about 47 percent year over year and up 86 percent from two years ago (ATTOM Data Solutions). That two-year climb is steeper than Georgia’s, Texas’s, Florida’s, or South Carolina’s. The state now ranks 13th nationally by foreclosure rate.
But the increase is not happening where the growth is. We built a county-level Foreclosure Risk Index from four public datasets and scored 75 of North Carolina’s 100 counties. The result describes two states sharing a border.
One is the North Carolina people move to. Wake County, home to Raleigh, ranks 73rd of 75. Durham ranks 74th, Orange County 72nd, and Mecklenburg County, home to Charlotte, 58th. Every large metropolitan county in the state grades Lower.
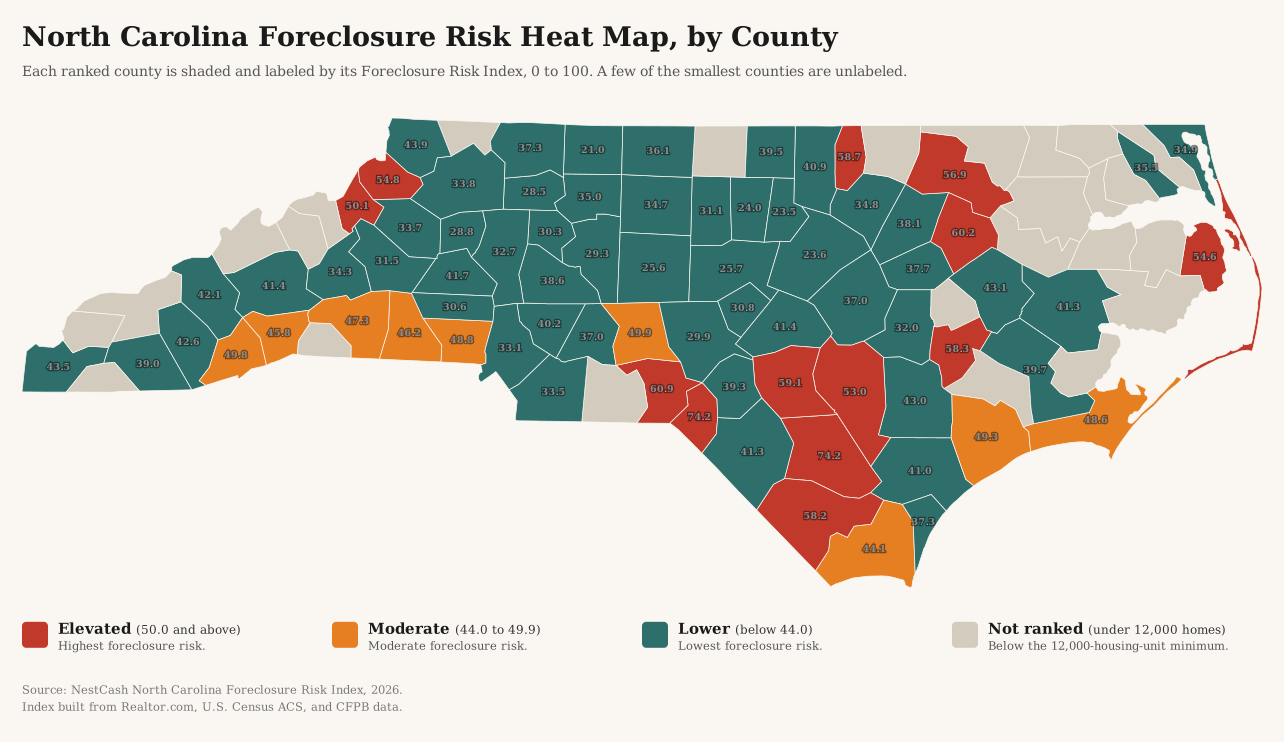
The other is the rural east. Scotland and Bladen counties tie at the top with 74.2, and the Elevated tier is dominated by the tobacco, textile, and farming counties of the coastal plain and the Sandhills: Richmond, Edgecombe, Vance, Lenoir, Columbus, Halifax, Sampson. Scotland at 74.2 and Wake at 23.6 sit 50.6 points apart. Measured against Mecklenburg, the state’s largest housing market, at 33.1, the distance between North Carolina’s top-ranked county and its biggest metropolitan county is 41.1 points, the widest in this series.
There is one exception to the metro rule, and it is a telling one. Cumberland County, home to Fayetteville, ranks fifth at 59.1. ATTOM’s own data agrees: Fayetteville posted one of the highest metropolitan foreclosure rates in the country in the first half of 2026 at 0.36 percent.
We score each county from 0 to 100 by blending four public signals, each weighted by how directly it bears on a mortgaged homeowner: market softness (35 percent), mortgage cost burden (30 percent), 90-day mortgage delinquency (20 percent), and unemployment (15 percent). Each signal is min-max normalized within North Carolina, so the score ranks counties against one another in the state, not against a national or absolute standard. A county grades Elevated at 50 or above, Moderate from 44 to 49.9, and Lower below 44. One rule keeps the ranking honest: we rank the 75 counties with at least 12,000 housing units. North Carolina has 100 counties, and the other 25 have too few homes for sale to score a market reliably, so they stay in the data but are not ranked. The 75 ranked counties hold 95.9 percent of the state’s homes. The full weighting, the normalization, and the limits of the data are spelled out in the methodology section below.
Key findings
- Foreclosure activity is rising fast. 8,429 filings in the first half of 2026, one per 581 housing units, up about 47 percent year over year and 86 percent from two years ago (ATTOM Data Solutions). North Carolina ranks 13th nationally by rate.
- Every major metro grades Lower, except Fayetteville. Wake 23.6, Durham 23.5, Orange 24.0, Mecklenburg 33.1, Guilford 34.7, Forsyth 35.0, New Hanover 37.3, and Buncombe 41.4 all sit in the Lower tier. Cumberland County, home to Fayetteville, is the sole metropolitan exception at 59.1, ranked fifth.
- The rural east carries the risk. Scotland County and Bladen tie at 74.2, followed by Richmond (60.9), Edgecombe (60.2), Cumberland (59.1), Vance (58.7), Lenoir (58.3), Columbus (58.2), and Halifax (56.9). These are the coastal plain and Sandhills counties left behind by the collapse of tobacco and textiles.
- The drivers are cost burden and jobs, not overbuilding. Columbus County’s mortgaged owners carry a 36.1 percent housing cost burden and Halifax’s 35.8 percent. Scotland County’s unemployment rate is 10.9 percent, the highest in the state, and Richmond’s is 9.8 percent. These are stretched places, not speculative ones.
- Three tourism counties break the rural pattern. Watauga (54.8), home to Boone, Dare (54.6) on the Outer Banks, and Avery (50.1) reach the Elevated tier on a different mechanism: second-home cost burden above 31 percent and listings that sit 79 to 89 days. They are the same dynamic we found in Pennsylvania’s Poconos.
Methodology
Data and sources
We built the index entirely from public and openly licensed data, and we cite each source at the point of use. Market conditions come from Realtor.com Economic Research (county listing data through August 2026). Housing tenure, mortgage status, cost burden, county housing counts, and unemployment come from the U.S. Census Bureau’s American Community Survey five-year estimates. Mortgage delinquency comes from the Consumer Financial Protection Bureau’s Mortgage Performance Trends (latest data December 2025). Statewide filing counts, the national rank, and trend come from ATTOM Data Solutions’ published foreclosure market reports. Every dataset we used is free and publicly available.
Building the index
The North Carolina Foreclosure Risk Index uses the same formula as every state in this series, a weighted blend of four signals, each chosen because it precedes or predicts foreclosure among homeowners who carry a mortgage:
35%
The share of active listings with a price cut and the median days a home sits on the market. A soft market matters because a homeowner in trouble who cannot sell quickly has fewer ways to avoid foreclosure.
30%
The share of owners with a mortgage who spend more than 30 percent of household income on housing. This is direct payment stress on the exact population that can be foreclosed on.
20%
The 90-day-or-more delinquency rate, the clearest early warning that foreclosures are coming.
15%
A secondary driver. We hold its weight down deliberately, because unemployment also captures renters and therefore dilutes a signal meant to describe homeowners.
We normalized each signal across the ranking-eligible counties on a 0-to-1 scale, where 0 is the lowest value in that set and 1 is the highest, then applied the weights above and multiplied by 100. The result is a relative score: it ranks North Carolina counties against one another, not against a national or absolute standard. We then graded each county by its score, Elevated for 50.0 or above, Moderate for 44.0 to 49.9, and Lower for anything below 44.0. Thirteen counties land in the Elevated tier, nine in Moderate, and 53 in Lower.
North Carolina has 100 counties, more than any state we have indexed except Texas, and many are very small. We limited the ranking to counties with at least 12,000 housing units, the same floor we used for Pennsylvania, Ohio, Illinois, and Texas, because price-cut shares and days-on-market figures drawn from a handful of listings are too noisy to rank. That excludes 25 counties, which are scored and shown in the full table but carry no rank.
Limitations
Three limits are worth stating plainly. First, the index is relative. A Lower grade means lower risk than other North Carolina counties, not low risk in absolute terms, and in a state where filings are up 86 percent in two years that distinction matters. Second, the CFPB reports county delinquency only where a county has at least 1,000 mortgages, so for 51 of the 75 ranked counties we substituted North Carolina’s statewide rate of 0.9 percent. Because that component carries 20 percent of the weight, the substitution compresses differences between small counties rather than inventing them, and every substituted county is marked in the table. Third, the index measures leading pressure, not completed foreclosures. Where our scores and realized foreclosure rates disagree, we say so rather than force a match.
Findings
The index: two North Carolinas
Ranked from most to least risk, the index splits the state almost perfectly along the line between the places people are moving to and the places they are moving from.
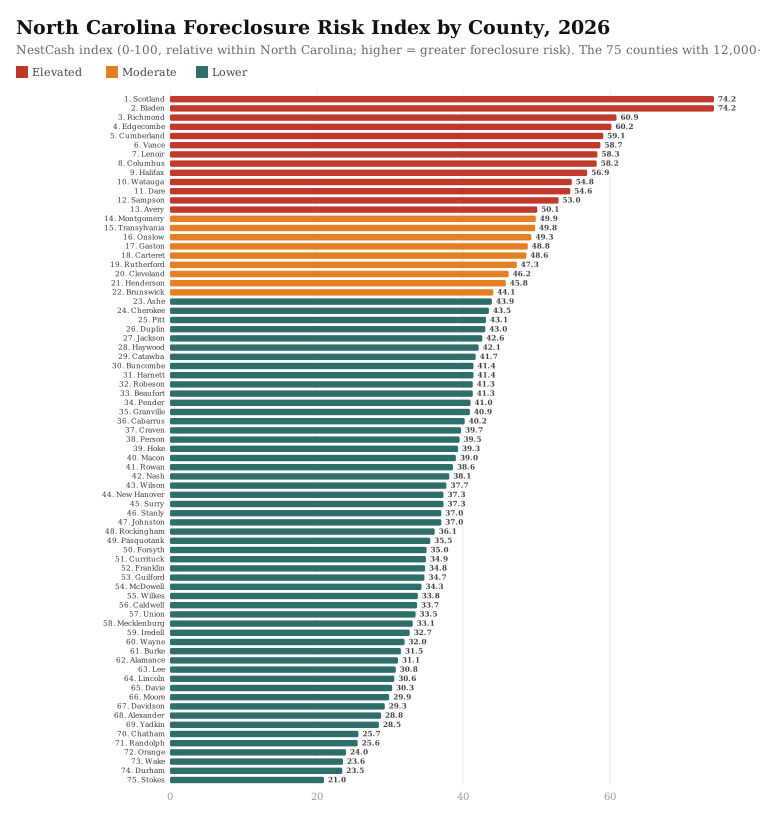
Scotland County and Bladen County tie at the top with 74.2, and between them they show both routes into the Elevated tier. Scotland, in the Sandhills on the South Carolina line, gets there on jobs: a 10.9 percent unemployment rate, the highest in North Carolina, paired with a 32.0 percent housing cost burden. Bladen, in the coastal plain, gets there on market conditions: 32.7 percent of its active listings carry a price cut and the typical home sits 106 days, both the worst figures in the state, against statewide medians of 22.0 percent and 68 days.
Below them the pattern holds. Richmond (60.9) carries a 35.0 percent cost burden and 9.8 percent unemployment. Edgecombe (60.2), which contains part of Rocky Mount, pairs 8.7 percent unemployment with a 31.2 percent cost burden. Vance (58.7) on the Virginia line, Lenoir (58.3) around Kinston, Columbus (58.2) with the heaviest cost burden in the state at 36.1 percent, and Halifax (56.9) at 35.8 percent complete the coastal-plain cluster. The same counties stand out nationally on our Vacant & Abandoned Property Index: Halifax ranks third of 1,129 counties, Columbus 11th, Edgecombe 13th, and Lenoir 29th, all Elevated.
None of this is a burst bubble. These counties did not overbuild. They are places where housing costs consume a third of a mortgaged household’s income while the local job market thins, which is the condition under which one setback becomes a missed payment.
The metros: the safest ground in a fast-rising state
In a state where filings are up 86 percent in two years, the places you have heard of are the safe ones. Wake County, home to Raleigh, ranks 73rd of 75 at 23.6. Durham ranks 74th at 23.5 and Orange County, home to Chapel Hill, 72nd at 24.0. The entire Research Triangle sits in the bottom four. Mecklenburg County, home to Charlotte and the state’s largest housing market, ranks 58th at 33.1. Guilford (34.7), Forsyth (35.0), New Hanover around Wilmington (37.3), and Buncombe around Asheville (41.4) all grade Lower.
Their delinquency rates explain why. Wake and Durham both sit at 0.5 percent against a statewide 0.9 percent, and Orange County sits at 0.4 percent, second only to Moore County statewide. Strong job markets and rising values give a struggling owner an exit that a soft rural market does not.
The relative nature of this index matters here. These metros grade Lower against the rest of North Carolina, not against the country, and North Carolina’s filings are climbing steeply. “The safest ground in North Carolina” is not the same as safe.
Fayetteville: the exception that both datasets agree on
One metropolitan county breaks the pattern completely. Cumberland County, home to Fayetteville and Fort Bragg, ranks fifth in the state at 59.1. It carries a 30.1 percent cost burden, 7.6 percent unemployment, and a 1.5 percent serious delinquency rate, third highest of any county in North Carolina and the highest of any county in the Elevated tier.
What makes this worth flagging is that our index and ATTOM’s realized data agree on it independently. ATTOM reported Fayetteville among the metropolitan areas with the highest foreclosure rates in the country in the first half of 2026, at 0.36 percent, more than double the national figure. Our index is built from leading indicators and does not include filing counts, so the agreement is not circular. When a leading-pressure model and a realized-outcome count both single out the same metro in a state where every other metro grades Lower, that is the one place in North Carolina worth watching closest.
The mountain and coastal exception
Three counties in the Elevated tier are not part of the eastern story at all. Watauga (54.8), home to Boone and Appalachian State, Dare (54.6) on the Outer Banks, and Avery (50.1) in the high country reach the top tier through a different mechanism. Their unemployment is moderate and their cost burdens are high: 31.9 percent in Watauga, 33.9 percent in Dare. Their listings sit 79 to 89 days.
That is the signature of a second-home and seasonal market where housing costs are set by outside buyers while year-round local incomes are not. We found exactly the same pattern in Pennsylvania’s Pocono counties, and it is worth naming as its own category: not rural decline and not metropolitan strength, but a vacation market whose price level has drifted away from the people who live there full time.
Rate versus volume
Risk per homeowner and total foreclosure volume are different measurements. The Elevated counties of the coastal plain are small: Scotland has 14,441 housing units and Bladen 15,286, so even at the top of the index they will never generate many filings in raw terms. Mecklenburg has 503,071 and Wake 496,047, so between them they will produce a large share of North Carolina’s filings simply by being large, despite grading Lower.
Cumberland is the county where the two measures meet. It has 143,798 housing units and an Elevated score, which is why it shows up in ATTOM’s metro rankings and the rural counties above it do not. For a homeowner weighing their own exposure, the index is the relevant number. For anyone sizing the market, volume is.
If you are a North Carolina homeowner facing foreclosure
This report is a market analysis, not legal advice, but the data points to a few things worth knowing. North Carolina uses a non-judicial power-of-sale foreclosure process, which runs through a hearing before the clerk of superior court rather than a full lawsuit. That makes it considerably faster than a judicial state like Pennsylvania, so the window to act is shorter.
You are entitled to notice of that hearing, generally at least 10 days beforehand, and the hearing itself is where a homeowner can contest whether the lender has the right to foreclose. After a sale there is a 10-day upset bid period during which a higher bid can be entered, which delays finality but is not a redemption right. The practical takeaway is that waiting is expensive: the process moves in weeks, not months, and the options narrow quickly.
Because of that, acting early matters. Reinstatement, a loan modification, or selling the home before the sale can stop the process and limit the damage to your credit, since a foreclosure can remain on a credit report for up to seven years. NestCash works with North Carolina homeowners in exactly this situation. Our guide on how to sell a house in foreclosure walks through the timeline and the choices, we have written specifically about how to avoid foreclosure in Durham, and you can start with a cash offer anywhere in the state through our North Carolina home-buying page.
The full data
All 75 ranked counties, from highest to lowest Foreclosure Risk Index. An asterisk on the delinquency rate marks a county where the North Carolina statewide rate was substituted because the county’s own rate is not separately reported. See Methodology.
Market-softness figures come from Realtor.com’s August 2026 county file. In the state’s thinnest markets they rest on relatively few listings, so the price-cut share and median days on market for the smallest ranked counties carry more noise than the rest of the table.
| Rank | County | FRI | Grade | Price cuts | Median DOM | Cost burden | 90+ delinq | Unemployment |
|---|---|---|---|---|---|---|---|---|
| 1 | Scotland | 74.2 | Elevated | 28.7% | 92 | 32.0% | 0.9*% | 10.9% |
| 2 | Bladen | 74.2 | Elevated | 32.7% | 106 | 33.3% | 0.9*% | 5.4% |
| 3 | Richmond | 60.9 | Elevated | 19.9% | 68 | 35.0% | 0.9*% | 9.8% |
| 4 | Edgecombe | 60.2 | Elevated | 23.7% | 79 | 31.2% | 0.9*% | 8.7% |
| 5 | Cumberland | 59.1 | Elevated | 23.8% | 61 | 30.1% | 1.5% | 7.6% |
| 6 | Vance | 58.7 | Elevated | 30.9% | 67 | 29.3% | 0.9*% | 8.2% |
| 7 | Lenoir | 58.3 | Elevated | 24.5% | 72 | 30.7% | 0.9*% | 9.0% |
| 8 | Columbus | 58.2 | Elevated | 24.0% | 74 | 36.1% | 0.9*% | 4.4% |
| 9 | Halifax | 56.9 | Elevated | 12.7% | 74 | 35.8% | 0.9*% | 9.3% |
| 10 | Watauga | 54.8 | Elevated | 18.0% | 79 | 31.9% | 0.9*% | 7.9% |
| 11 | Dare | 54.6 | Elevated | 15.5% | 87 | 33.9% | 0.9*% | 5.9% |
| 12 | Sampson | 53.0 | Elevated | 22.7% | 91 | 28.5% | 0.9*% | 5.3% |
| 13 | Avery | 50.1 | Elevated | 18.8% | 89 | 29.9% | 0.9*% | 4.8% |
| 14 | Montgomery | 49.9 | Moderate | 21.0% | 92 | 30.3% | 0.9*% | 2.8% |
| 15 | Transylvania | 49.8 | Moderate | 19.4% | 95 | 30.5% | 0.9*% | 2.8% |
| 16 | Onslow | 49.3 | Moderate | 15.8% | 65 | 29.1% | 1.6% | 5.4% |
| 17 | Gaston | 48.8 | Moderate | 28.3% | 63 | 26.5% | 1.2% | 4.8% |
| 18 | Carteret | 48.6 | Moderate | 14.1% | 98 | 30.6% | 0.9*% | 4.0% |
| 19 | Rutherford | 47.3 | Moderate | 24.8% | 79 | 24.9% | 0.9*% | 6.3% |
| 20 | Cleveland | 46.2 | Moderate | 27.6% | 67 | 26.6% | 0.9*% | 5.2% |
| 21 | Henderson | 45.8 | Moderate | 25.1% | 80 | 27.0% | 0.9*% | 3.5% |
| 22 | Brunswick | 44.1 | Moderate | 21.2% | 76 | 30.4% | 0.6% | 4.7% |
| 23 | Ashe | 43.9 | Lower | 21.9% | 78 | 26.4% | 0.9*% | 4.8% |
| 24 | Cherokee | 43.5 | Lower | 21.4% | 86 | 25.5% | 0.9*% | 4.1% |
| 25 | Pitt | 43.1 | Lower | 16.0% | 65 | 23.8% | 1.4% | 7.8% |
| 26 | Duplin | 43.0 | Lower | 17.1% | 83 | 26.9% | 0.9*% | 5.3% |
| 27 | Jackson | 42.6 | Lower | 16.3% | 92 | 25.6% | 0.9*% | 4.9% |
| 28 | Haywood | 42.1 | Lower | 22.2% | 81 | 26.5% | 0.9*% | 3.1% |
| 29 | Catawba | 41.7 | Lower | 25.4% | 56 | 21.6% | 1.7% | 3.7% |
| 30 | Buncombe | 41.4 | Lower | 26.1% | 78 | 25.8% | 0.6% | 4.3% |
| 31 | Harnett | 41.4 | Lower | 21.1% | 71 | 26.9% | 0.9% | 4.7% |
| 32 | Robeson | 41.3 | Lower | 15.6% | 73 | 28.0% | 0.9*% | 6.0% |
| 33 | Beaufort | 41.3 | Lower | 21.4% | 85 | 24.5% | 0.9*% | 3.9% |
| 34 | Pender | 41.0 | Lower | 20.0% | 65 | 28.5% | 0.9*% | 4.8% |
| 35 | Granville | 40.9 | Lower | 23.5% | 73 | 24.9% | 0.9*% | 4.6% |
| 36 | Cabarrus | 40.2 | Lower | 28.0% | 60 | 22.8% | 1.1% | 4.6% |
| 37 | Craven | 39.7 | Lower | 19.3% | 68 | 28.1% | 0.9*% | 4.2% |
| 38 | Person | 39.5 | Lower | 24.1% | 63 | 24.6% | 0.9*% | 5.6% |
| 39 | Hoke | 39.3 | Lower | 18.7% | 58 | 27.5% | 0.9*% | 6.6% |
| 40 | Macon | 39.0 | Lower | 17.9% | 86 | 26.2% | 0.9*% | 2.8% |
| 41 | Rowan | 38.6 | Lower | 24.9% | 67 | 24.9% | 0.7% | 5.3% |
| 42 | Nash | 38.1 | Lower | 19.3% | 77 | 24.2% | 0.9*% | 4.9% |
| 43 | Wilson | 37.7 | Lower | 19.9% | 69 | 24.5% | 0.9*% | 5.6% |
| 44 | New Hanover | 37.3 | Lower | 24.1% | 64 | 27.1% | 0.6% | 4.5% |
| 45 | Surry | 37.3 | Lower | 23.3% | 61 | 25.5% | 0.9*% | 4.4% |
| 46 | Stanly | 37.0 | Lower | 24.3% | 65 | 24.2% | 0.9*% | 4.1% |
| 47 | Johnston | 37.0 | Lower | 25.6% | 61 | 22.8% | 1.1% | 3.8% |
| 48 | Rockingham | 36.1 | Lower | 20.9% | 57 | 25.3% | 0.9*% | 5.8% |
| 49 | Pasquotank | 35.5 | Lower | 14.5% | 65 | 26.7% | 0.9*% | 5.9% |
| 50 | Forsyth | 35.0 | Lower | 23.1% | 54 | 24.0% | 1.0% | 5.0% |
| 51 | Currituck | 34.9 | Lower | 15.4% | 75 | 27.1% | 0.9*% | 3.0% |
| 52 | Franklin | 34.8 | Lower | 20.8% | 72 | 22.6% | 0.9*% | 4.6% |
| 53 | Guilford | 34.7 | Lower | 23.8% | 58 | 23.9% | 0.9% | 4.6% |
| 54 | McDowell | 34.3 | Lower | 23.0% | 79 | 20.0% | 0.9*% | 4.1% |
| 55 | Wilkes | 33.8 | Lower | 17.1% | 72 | 23.6% | 0.9*% | 5.0% |
| 56 | Caldwell | 33.7 | Lower | 27.3% | 58 | 20.7% | 0.9*% | 5.0% |
| 57 | Union | 33.5 | Lower | 28.2% | 57 | 22.2% | 0.8% | 4.2% |
| 58 | Mecklenburg | 33.1 | Lower | 26.6% | 59 | 23.3% | 0.7% | 4.3% |
| 59 | Iredell | 32.7 | Lower | 25.1% | 67 | 22.2% | 0.7% | 4.2% |
| 60 | Wayne | 32.0 | Lower | 18.2% | 65 | 23.1% | 0.9*% | 5.2% |
| 61 | Burke | 31.5 | Lower | 23.0% | 61 | 21.8% | 0.9*% | 4.4% |
| 62 | Alamance | 31.1 | Lower | 19.3% | 64 | 22.2% | 0.9% | 5.1% |
| 63 | Lee | 30.8 | Lower | 15.4% | 59 | 27.0% | 0.9*% | 3.8% |
| 64 | Lincoln | 30.6 | Lower | 24.8% | 59 | 22.0% | 0.9*% | 3.3% |
| 65 | Davie | 30.3 | Lower | 22.0% | 68 | 19.7% | 0.9*% | 4.7% |
| 66 | Moore | 29.9 | Lower | 20.3% | 75 | 24.4% | 0.3% | 4.8% |
| 67 | Davidson | 29.3 | Lower | 25.9% | 58 | 20.7% | 0.8% | 4.1% |
| 68 | Alexander | 28.8 | Lower | 25.0% | 70 | 16.1% | 0.9*% | 5.0% |
| 69 | Yadkin | 28.5 | Lower | 17.0% | 61 | 22.2% | 0.9*% | 5.3% |
| 70 | Chatham | 25.7 | Lower | 16.4% | 61 | 23.7% | 0.9*% | 2.9% |
| 71 | Randolph | 25.6 | Lower | 21.7% | 54 | 22.3% | 0.8% | 3.5% |
| 72 | Orange | 24.0 | Lower | 22.5% | 64 | 22.2% | 0.4% | 3.6% |
| 73 | Wake | 23.6 | Lower | 24.9% | 58 | 20.3% | 0.5% | 4.1% |
| 74 | Durham | 23.5 | Lower | 22.2% | 61 | 21.4% | 0.5% | 3.9% |
| 75 | Stokes | 21.0 | Lower | 17.6% | 68 | 18.0% | 0.9*% | 3.1% |
Twenty-five counties are scored but not ranked because they fall below the 12,000-housing-unit floor: Alleghany, Anson, Bertie, Camden, Caswell, Chowan, Clay, Gates, Graham, Greene, Hertford, Hyde, Jones, Madison, Martin, Mitchell, Northampton, Pamlico, Perquimans, Polk, Swain, Tyrrell, Warren, Washington, and Yancey.
What we will watch
We plan to update this index quarterly. Three things will tell us where North Carolina goes from here: whether the 86 percent two-year climb in filings continues or levels off, which will determine how much the Lower grades in the Triangle and Charlotte are actually worth; whether Cumberland County’s 1.5 percent delinquency rate spreads to any other metropolitan county, since it is currently the one metro carrying rural-level pressure; and whether the coastal plain counties’ price-cut shares keep widening the gap with the rest of the state. North Carolina is growing fast and its foreclosures are growing faster. The next few quarters will show whether those two facts stay in separate halves of the state.
Sources and data
- Foreclosure activity and trend. ATTOM Data Solutions, 2026 Mid-Year U.S. Foreclosure Market Report and its quarterly and monthly reports. Used for statewide filing counts, the national rank, the Fayetteville metro rate, and the year-over-year and two-year changes.
- Housing market softness. Realtor.com Economic Research, county inventory core metrics through August 2026. Used for the price-cut share, median days on market, and active listing counts.
- Housing, mortgage status, cost burden, and unemployment. U.S. Census Bureau, American Community Survey five-year estimates. Used for county housing counts, the mortgaged-owner universe, housing cost burden, and the unemployment rate.
- Mortgage delinquency. CFPB Mortgage Performance Trends, data through December 2025. Used for the 90-or-more day delinquency rates.
About NestCash
NestCash buys houses for cash in twelve states, including throughout North Carolina. We publish original housing research to help homeowners, buyers, and investors understand the markets we work in. This report may be cited and its charts embedded with attribution to NestCash.

John is the Founder of NestCash and a leading voice in real estate investing and housing market strategy. With experience across 12 states, he helps buyers, sellers, and investors make smarter decisions using real-world insight and market data.