

The 2026 Pennsylvania Foreclosure Risk Index
Where financial pressure on Pennsylvania homeowners is building, county by county
 Published on September 23rd, 2026, by John Carter | Founder, NestCash
Original NestCash research, free to read and cite. If you need to sell a house fast in Pennsylvania, start here.

Abstract
Pennsylvania looks unremarkable in the national foreclosure tables. It ranked 19th by foreclosure rate in the first half of 2026, with 8,399 filings, one for every 691 housing units, a rate below the national average (ATTOM Data Solutions). That placement hides two things worth knowing.
The first is that Pennsylvania foreclosures finish. The state recorded 1,893 completed bank repossessions in the first half of 2026, fourth in the nation behind only Texas, California, and Florida, and ahead of every state that outranks it on filing rate. A middling rate of entry is producing a top-five volume of completed foreclosures.
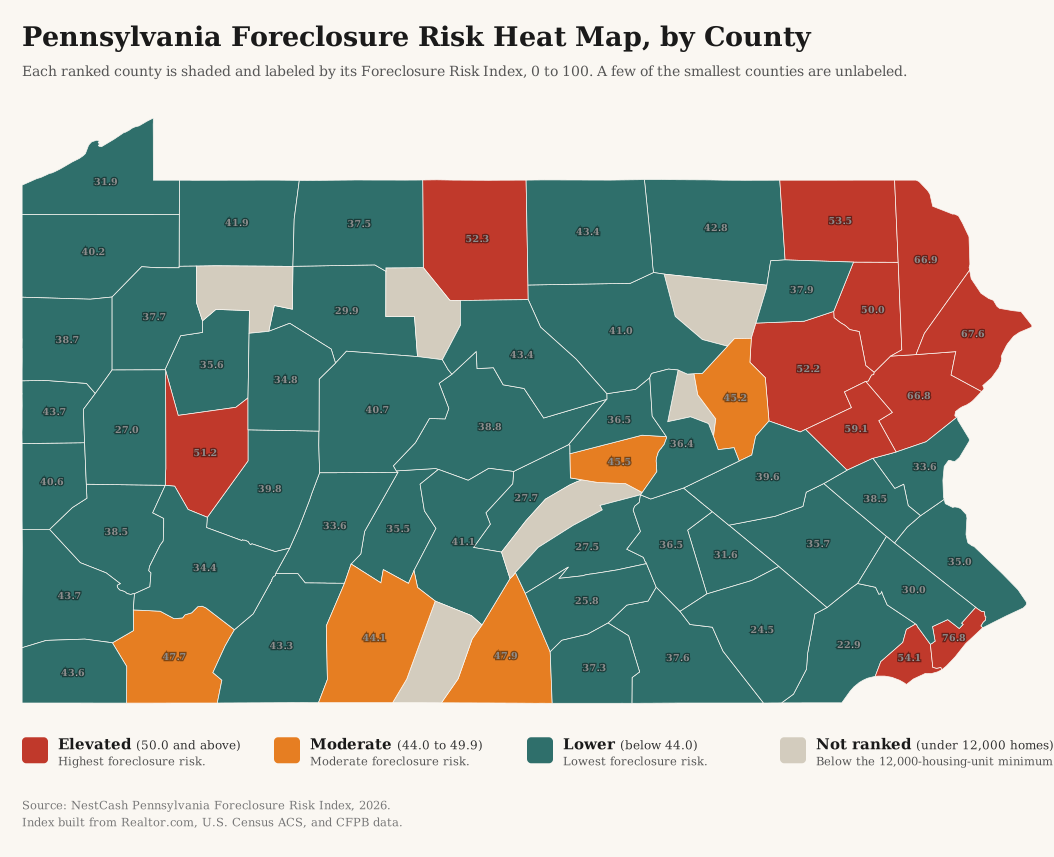
The second is where the pressure sits. We built a county-level Foreclosure Risk Index from four public datasets and scored 61 of Pennsylvania’s 67 counties. The result is not the Rust Belt story the state’s reputation would predict. Philadelphia tops the index at 76.8, nine points clear of anywhere else. And the entire second cluster is the Pocono Mountains: Pike (67.6), Wayne (66.9), Monroe (66.8), and Carbon (59.1) take four of the top five places. Pittsburgh’s Allegheny County, Erie, Bethlehem’s Northampton County, and the old steel and coal counties of the southwest all grade Lower.
This report explains how the index is built, publishes every county score, and describes what the two clusters have in common, which is less than it first appears.
Key findings
- Pennsylvania ranks 19th by rate but fourth by completed foreclosures. First-half 2026 filings totaled 8,399, one per 691 housing units, up about 20 percent year over year. But its 1,893 completed repossessions trail only Texas, California, and Florida (ATTOM Data Solutions). Entries are ordinary; completions are not.
- Philadelphia is in a category of its own. The city scores 76.8, nine points above the next county. It carries the state’s highest serious mortgage delinquency rate at 1.8 percent, its highest unemployment rate at 8.1 percent, and a 31.2 percent housing cost burden among mortgaged owners.
- The second cluster is the Poconos, not the Rust Belt. Pike, Wayne, Monroe, and Carbon counties, the four that make up the Pocono Mountains, occupy four of the top five slots. This is a second-home and exurban commuter market that absorbed enormous demand between 2020 and 2022 and is now the softest housing in the state.
- The southwest is not where the risk is. Allegheny County, home to Pittsburgh, grades Lower at 38.5. So do Westmoreland (34.4), Beaver (40.6), Cambria (33.6), and Erie (31.9). Armstrong County (51.2) is the one southwestern exception, and it got there on market softness alone: 35.4 percent of its active listings carry a price cut, the highest share in Pennsylvania.
- The safest counties are the prosperous Philadelphia and Harrisburg collars. Chester (22.9), Lancaster (24.5), Cumberland (25.8), and Butler (27.0) anchor the bottom of the table. Chester and Delaware counties border each other and sit 31 points apart.
Methodology
Data and sources
We built the index entirely from public and openly licensed data, and we cite each source at the point of use. Market conditions come from Realtor.com Economic Research (county listing data through August 2026). Housing tenure, mortgage status, cost burden, county housing counts, and unemployment come from the U.S. Census Bureau’s American Community Survey five-year estimates. Mortgage delinquency comes from the Consumer Financial Protection Bureau’s Mortgage Performance Trends (latest data December 2025). Statewide filing counts, the national rank, and trend come from ATTOM Data Solutions’ published foreclosure market reports. Every dataset we used is free and publicly available.
Building the index
The Pennsylvania Foreclosure Risk Index is a weighted blend of four signals, each chosen because it precedes or predicts foreclosure among homeowners who carry a mortgage:
35%
The share of active listings with a price cut and the median days a home sits on the market. A soft market matters because a homeowner in trouble who cannot sell quickly has fewer ways to avoid foreclosure.
30%
The share of owners with a mortgage who spend more than 30 percent of household income on housing. This is direct payment stress on the exact population that can be foreclosed on.
20%
The 90-day-or-more delinquency rate, the clearest early warning that foreclosures are coming.
15%
A secondary driver. We hold its weight down deliberately, because unemployment also captures renters and therefore dilutes a signal meant to describe homeowners.
We normalized each signal across the ranking-eligible counties on a 0-to-1 scale, where 0 is the lowest value in that set and 1 is the highest, then applied the weights above and multiplied by 100. The result is a relative score: it ranks Pennsylvania counties against one another, not against a national or absolute standard. We then graded each county by its score, Elevated for 50.0 or above, Moderate for 44.0 to 49.9, and Lower for anything below 44.0. Eleven counties land in the Elevated tier, five in Moderate, and 45 in Lower.
Pennsylvania has 67 counties, and several are very small. We limited the ranking to counties with at least 12,000 housing units, the same floor we used for Ohio, Illinois, and Texas, because price-cut shares and days-on-market figures drawn from a handful of listings are too noisy to rank. That excludes six counties: Cameron, Forest, Fulton, Juniata, Montour, and Sullivan. They are scored and shown in the full table but carry no rank.
Limitations
Three limits are worth stating plainly. First, the index is relative. A Lower grade means lower risk than other Pennsylvania counties, not low risk in absolute terms. Second, the CFPB reports county delinquency only where a county has at least 1,000 mortgages, so for 38 of the 61 ranked counties we substituted Pennsylvania’s statewide rate of 1.0 percent. Because that component carries 20 percent of the weight, the substitution compresses differences between small counties rather than inventing them, and every substituted county is marked in the table. Third, the index measures leading pressure, not completed foreclosures. Where our scores and realized foreclosure counts disagree, we say so rather than force a match.
Findings
The index: one city, and one mountain range
Ranked from most to least risk, the index describes a state with two separate problems that happen to share a top ten.
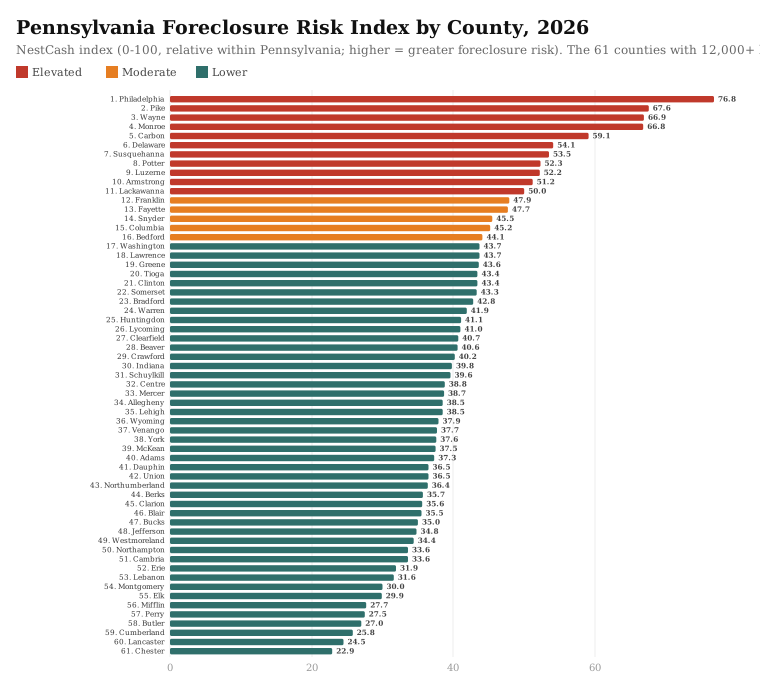
Philadelphia tops the index at 76.8, and the gap beneath it is the second largest we have measured in any state, behind only Georgia’s. Nine points separate it from second place. The city leads Pennsylvania on two of the four inputs outright: an 8.1 percent unemployment rate and a 1.8 percent serious mortgage delinquency rate, both the highest in the state. Add a 31.2 percent cost burden among mortgaged owners and a market where the typical listing sits 65 days, and the result is a county under pressure on every axis at once. Philadelphia is not a soft-market story or a jobs story. It is both, in the same place, in the state’s largest housing stock.
The Poconos: a boom market with a hangover
Then the surprise. Pike County ranks second at 67.6, Wayne third at 66.9, Monroe fourth at 66.8, and Carbon fifth at 59.1. Those four counties are the Pocono Mountains, and they are not a distressed industrial region. They are a second-home and long-distance commuter market that sits within driving range of both New York City and Philadelphia.
What the data shows there is a demand shock unwinding. Monroe County’s active listings carry a 21.2 percent price-cut share and Pike’s 20.1 percent, against a statewide median of 17.4 percent. Homes sit 60 days in Monroe, 71 in Pike, and 73 in Wayne, against a statewide median of 52. Wayne County’s mortgaged owners carry a 34.6 percent housing cost burden, the heaviest of any Elevated county including Philadelphia. Pike County’s unemployment rate is 7.5 percent, tied with Carbon for the highest in Pennsylvania behind Philadelphia.
The pattern is consistent with a market that absorbed a large wave of buyers between 2020 and 2022, many of them stretching to buy at the top of their budget in a region with thin year-round employment, and is now working through the consequences. Monroe County carries a 1.5 percent delinquency rate, well above the 1.0 percent statewide figure and the highest of any Pocono county. That is the signal that separates a slow market from a distressed one, and in the Poconos it is present.
Where the risk is not: the southwest
The counties most people associate with Pennsylvania economic decline are not the ones carrying foreclosure risk. Allegheny County, home to Pittsburgh, grades Lower at 38.5. So do Westmoreland (34.4), Beaver (40.6), Cambria (33.6), Washington (43.7), and Erie (31.9). The southwest’s housing is inexpensive relative to local incomes, which keeps cost burden low, and that single fact outweighs a great deal.
Armstrong County is the exception at 51.2, and it is instructive. Its cost burden is only 20.5 percent, below the state median, and its unemployment rate is 4.3 percent. It reaches the Elevated tier almost entirely on market softness: 35.4 percent of its active listings carry a price cut, the highest share of any county in Pennsylvania. A market that soft gives a struggling owner no exit, which is precisely the mechanism the softness weight is meant to capture.
The northeast tells a different story from the southwest. Luzerne County (52.2), which includes Wilkes-Barre, and Lackawanna County (50.0), which includes Scranton, both grade Elevated, and both carry above-average delinquency at 1.3 and 1.6 percent. They sit immediately adjacent to the Poconos, and the distinction between an old anthracite economy and a spillover commuter market is blurrier there than a map suggests.
Rate versus volume
Risk per homeowner and total foreclosure volume are different measurements, and Pennsylvania separates them unusually clearly. Philadelphia carries both: the highest risk per homeowner and, with 748,270 housing units, by far the largest absolute volume. The Poconos counties are the opposite. Pike has 40,177 housing units and Wayne 32,171, so even at scores near 67 they will never generate many filings in raw terms.
Meanwhile Allegheny, Montgomery, Bucks, and Lancaster hold enormous housing stocks at Lower grades, and between them will produce a large share of the state’s filings simply by being large. For a homeowner weighing their own exposure, the index is the relevant number. For anyone sizing the market, volume is. Pennsylvania’s fourth-in-the-nation completed-foreclosure count is a volume fact, and it is driven by the size of the state rather than the intensity of its distress.
If you are a Pennsylvania homeowner facing foreclosure
This report is a market analysis, not legal advice, but the data points to a few things worth knowing. Pennsylvania is a judicial foreclosure state, which means a lender must file a lawsuit and win a judgment in the Court of Common Pleas before a sheriff’s sale can happen. That court process takes time and gives a homeowner real procedural rights.
Pennsylvania also has something most states do not. Before a lender can begin foreclosure on an owner-occupied home, it generally must send an Act 91 notice, which opens a window to apply for the Homeowners’ Emergency Mortgage Assistance Program run by the Pennsylvania Housing Finance Agency. HEMAP is a state-funded loan program that can bring a delinquent mortgage current for a borrower facing a temporary, documented financial hardship, and it is one of the few programs of its kind in the country. The application deadline attached to that notice is short, usually 33 days, so the notice is worth opening the day it arrives.
Acting early matters either way. Reinstatement, a loan modification, or selling the home before the sheriff’s sale can all stop the process and limit the damage to your credit, since a foreclosure can stay on a credit report for up to seven years. NestCash works with Pennsylvania homeowners in exactly this situation. Our guide on how to sell a house in foreclosure walks through the timeline and the choices, we have written specifically about how to stop foreclosure in Philadelphia, and you can start with a cash offer anywhere in the state through our Pennsylvania home-buying page.
The full data
All 61 ranked counties, from highest to lowest Foreclosure Risk Index. An asterisk on the delinquency rate marks a county where the Pennsylvania statewide rate was substituted because the county’s own rate is not separately reported. See Methodology.
Market-softness figures come from Realtor.com’s August 2026 county file. In the state’s thinnest markets they rest on relatively few listings, so the price-cut share and median days on market for the smallest ranked counties carry more noise than the rest of the table.
| Rank | County | FRI | Grade | Price cuts | Median DOM | Cost burden | 90+ delinq | Unemployment |
|---|---|---|---|---|---|---|---|---|
| 1 | Philadelphia | 76.8 | Elevated | 18.8% | 65 | 31.2% | 1.8% | 8.1% |
| 2 | Pike | 67.6 | Elevated | 20.1% | 71 | 31.6% | 1.0*% | 7.5% |
| 3 | Wayne | 66.9 | Elevated | 17.4% | 73 | 34.6% | 1.0*% | 6.0% |
| 4 | Monroe | 66.8 | Elevated | 21.2% | 60 | 29.0% | 1.5% | 6.9% |
| 5 | Carbon | 59.1 | Elevated | 14.5% | 69 | 28.7% | 1.0*% | 7.5% |
| 6 | Delaware | 54.1 | Elevated | 18.6% | 43 | 26.4% | 1.3% | 6.9% |
| 7 | Susquehanna | 53.5 | Elevated | 19.7% | 62 | 26.5% | 1.0*% | 5.9% |
| 8 | Potter | 52.3 | Elevated | 20.9% | 79 | 25.7% | 1.0*% | 3.8% |
| 9 | Luzerne | 52.2 | Elevated | 23.0% | 38 | 25.9% | 1.3% | 5.8% |
| 10 | Armstrong | 51.2 | Elevated | 35.4% | 62 | 20.5% | 1.0*% | 4.3% |
| 11 | Lackawanna | 50.0 | Elevated | 17.8% | 49 | 23.6% | 1.6% | 4.9% |
| 12 | Franklin | 47.9 | Moderate | 17.9% | 50 | 23.5% | 1.6% | 4.0% |
| 13 | Fayette | 47.7 | Moderate | 17.2% | 57 | 23.9% | 1.0*% | 6.3% |
| 14 | Snyder | 45.5 | Moderate | 30.3% | 80 | 19.0% | 1.0*% | 2.4% |
| 15 | Columbia | 45.2 | Moderate | 19.6% | 45 | 23.8% | 1.0*% | 6.0% |
| 16 | Bedford | 44.1 | Moderate | 17.7% | 59 | 25.0% | 1.0*% | 3.9% |
| 17 | Washington | 43.7 | Lower | 19.9% | 59 | 22.2% | 1.0% | 4.8% |
| 18 | Lawrence | 43.7 | Lower | 14.1% | 61 | 22.9% | 1.0*% | 5.7% |
| 19 | Greene | 43.6 | Lower | 9.3% | 92 | 19.6% | 1.0*% | 5.6% |
| 20 | Tioga | 43.4 | Lower | 15.0% | 59 | 24.6% | 1.0*% | 4.6% |
| 21 | Clinton | 43.4 | Lower | 17.6% | 48 | 23.6% | 1.0*% | 5.6% |
| 22 | Somerset | 43.3 | Lower | 19.8% | 57 | 22.1% | 1.0*% | 4.9% |
| 23 | Bradford | 42.8 | Lower | 13.5% | 48 | 23.9% | 1.0*% | 6.3% |
| 24 | Warren | 41.9 | Lower | 23.2% | 58 | 20.3% | 1.0*% | 4.4% |
| 25 | Huntingdon | 41.1 | Lower | 13.8% | 67 | 22.1% | 1.0*% | 4.6% |
| 26 | Lycoming | 41.0 | Lower | 18.2% | 51 | 22.0% | 1.0*% | 5.1% |
| 27 | Clearfield | 40.7 | Lower | 18.3% | 58 | 19.1% | 1.0*% | 5.9% |
| 28 | Beaver | 40.6 | Lower | 22.0% | 48 | 21.1% | 0.9% | 5.3% |
| 29 | Crawford | 40.2 | Lower | 17.5% | 57 | 20.9% | 1.0*% | 5.0% |
| 30 | Indiana | 39.8 | Lower | 12.1% | 40 | 23.2% | 1.0*% | 6.7% |
| 31 | Schuylkill | 39.6 | Lower | 18.2% | 53 | 19.8% | 1.0*% | 5.6% |
| 32 | Centre | 38.8 | Lower | 16.7% | 51 | 22.6% | 1.0*% | 4.3% |
| 33 | Mercer | 38.7 | Lower | 15.3% | 61 | 19.6% | 1.0*% | 5.3% |
| 34 | Allegheny | 38.5 | Lower | 21.1% | 53 | 19.7% | 0.9% | 5.0% |
| 35 | Lehigh | 38.5 | Lower | 14.0% | 36 | 25.4% | 0.8% | 5.9% |
| 36 | Wyoming | 37.9 | Lower | 15.8% | 58 | 19.9% | 1.0*% | 5.0% |
| 37 | Venango | 37.7 | Lower | 15.2% | 52 | 20.1% | 1.0*% | 5.6% |
| 38 | York | 37.6 | Lower | 16.6% | 35 | 23.5% | 1.1% | 4.5% |
| 39 | McKean | 37.5 | Lower | 20.2% | 55 | 18.3% | 1.0*% | 4.9% |
| 40 | Adams | 37.3 | Lower | 13.0% | 43 | 26.3% | 1.0*% | 3.4% |
| 41 | Dauphin | 36.5 | Lower | 19.7% | 38 | 22.6% | 0.9% | 4.5% |
| 42 | Union | 36.5 | Lower | 18.6% | 57 | 22.7% | 1.0*% | 2.2% |
| 43 | Northumberland | 36.4 | Lower | 17.0% | 54 | 21.3% | 1.0*% | 3.7% |
| 44 | Berks | 35.7 | Lower | 13.2% | 32 | 23.6% | 1.0% | 5.4% |
| 45 | Clarion | 35.6 | Lower | 15.6% | 71 | 15.9% | 1.0*% | 5.1% |
| 46 | Blair | 35.5 | Lower | 21.4% | 50 | 18.2% | 1.0*% | 4.4% |
| 47 | Bucks | 35.0 | Lower | 15.8% | 42 | 24.6% | 0.7% | 4.4% |
| 48 | Jefferson | 34.8 | Lower | 15.4% | 54 | 20.1% | 1.0*% | 4.2% |
| 49 | Westmoreland | 34.4 | Lower | 20.2% | 50 | 20.0% | 0.7% | 4.8% |
| 50 | Northampton | 33.6 | Lower | 12.5% | 31 | 23.2% | 1.1% | 4.6% |
| 51 | Cambria | 33.6 | Lower | 18.1% | 50 | 17.9% | 1.0*% | 4.7% |
| 52 | Erie | 31.9 | Lower | 12.7% | 34 | 22.7% | 0.8% | 5.4% |
| 53 | Lebanon | 31.6 | Lower | 15.0% | 40 | 23.2% | 0.7% | 4.3% |
| 54 | Montgomery | 30.0 | Lower | 14.7% | 40 | 22.8% | 0.6% | 4.5% |
| 55 | Elk | 29.9 | Lower | 12.9% | 61 | 14.0% | 1.0*% | 5.7% |
| 56 | Mifflin | 27.7 | Lower | 13.3% | 38 | 21.7% | 1.0*% | 2.7% |
| 57 | Perry | 27.5 | Lower | 10.7% | 28 | 23.9% | 1.0*% | 3.1% |
| 58 | Butler | 27.0 | Lower | 18.2% | 52 | 19.9% | 0.3% | 4.4% |
| 59 | Cumberland | 25.8 | Lower | 15.5% | 35 | 22.8% | 0.5% | 3.7% |
| 60 | Lancaster | 24.5 | Lower | 11.6% | 26 | 23.1% | 0.8% | 3.4% |
| 61 | Chester | 22.9 | Lower | 13.8% | 40 | 21.4% | 0.4% | 3.8% |
Six counties are scored but not ranked because they fall below the 12,000-housing-unit floor: Cameron, Forest, Fulton, Juniata, Montour, and Sullivan.
What we will watch
We plan to update this index quarterly. Three things will tell us where Pennsylvania goes from here: whether the Pocono counties’ price-cut shares keep climbing or level off, which will separate a correction from a genuine unwind; whether Philadelphia’s 1.8 percent delinquency rate moves, since it is the single clearest leading indicator in the state; and whether Pennsylvania’s fourth-place national standing in completed foreclosures holds as the pandemic-era backlog finishes clearing. A state can rank 19th on entries and fourth on completions for only so long before one of those numbers moves.
Sources and data
- Foreclosure activity and trend. ATTOM Data Solutions, 2026 Mid-Year U.S. Foreclosure Market Report and its quarterly and monthly reports. Used for statewide filing counts, the national rank, completed repossession counts, and the year-over-year change.
- Housing market softness. Realtor.com Economic Research, county inventory core metrics through August 2026. Used for the price-cut share, median days on market, and active listing counts.
- Housing, mortgage status, cost burden, and unemployment. U.S. Census Bureau, American Community Survey five-year estimates. Used for county housing counts, the mortgaged-owner universe, housing cost burden, and the unemployment rate.
- Mortgage delinquency. CFPB Mortgage Performance Trends, data through December 2025. Used for the 90-or-more day delinquency rates.
- Foreclosure prevention. Pennsylvania Housing Finance Agency, Homeowners’ Emergency Mortgage Assistance Program. Used for the Act 91 notice and HEMAP description.
About NestCash
NestCash buys houses for cash in twelve states, including throughout Pennsylvania. We publish original housing research to help homeowners, buyers, and investors understand the markets we work in. This report may be cited and its charts embedded with attribution to NestCash.

John is the Founder of NestCash and a leading voice in real estate investing and housing market strategy. With experience across 12 states, he helps buyers, sellers, and investors make smarter decisions using real-world insight and market data.