
The 2026 Kentucky Foreclosure Risk Index
Where financial pressure on Kentucky homeowners is building, county by county
 Published on October 14th, 2026, by John Carter | Founder, NestCash
Original NestCash research, free to read and cite.

Abstract
Kentucky sits in the middle of the national foreclosure table. In the first half of 2026 the state recorded 2,053 foreclosure filings, one for every 985 housing units, the 32nd-highest rate of any state and below the national rate of one in 632. Filings were up 19 percent from the first half of 2025 and 25 percent from the first half of 2024, close to the national increases of 21 and 28 percent. Kentucky’s rate is half of Ohio’s and well below Indiana’s and Illinois’, level with Tennessee, Virginia, and Missouri, and above West Virginia (ATTOM Data Solutions). What stands out is what happens to the homes. In the third quarter of 2026, 5.1 percent of Kentucky homes in the foreclosure process were vacant, so-called zombie foreclosures, the 14th-highest share of any state and well above the national 3.3 percent. At the end of 2025, 1.0 percent of Kentucky mortgages were 90 or more days delinquent, slightly above the national 0.9 percent and up from 0.9 percent at the end of 2024 (Consumer Financial Protection Bureau).
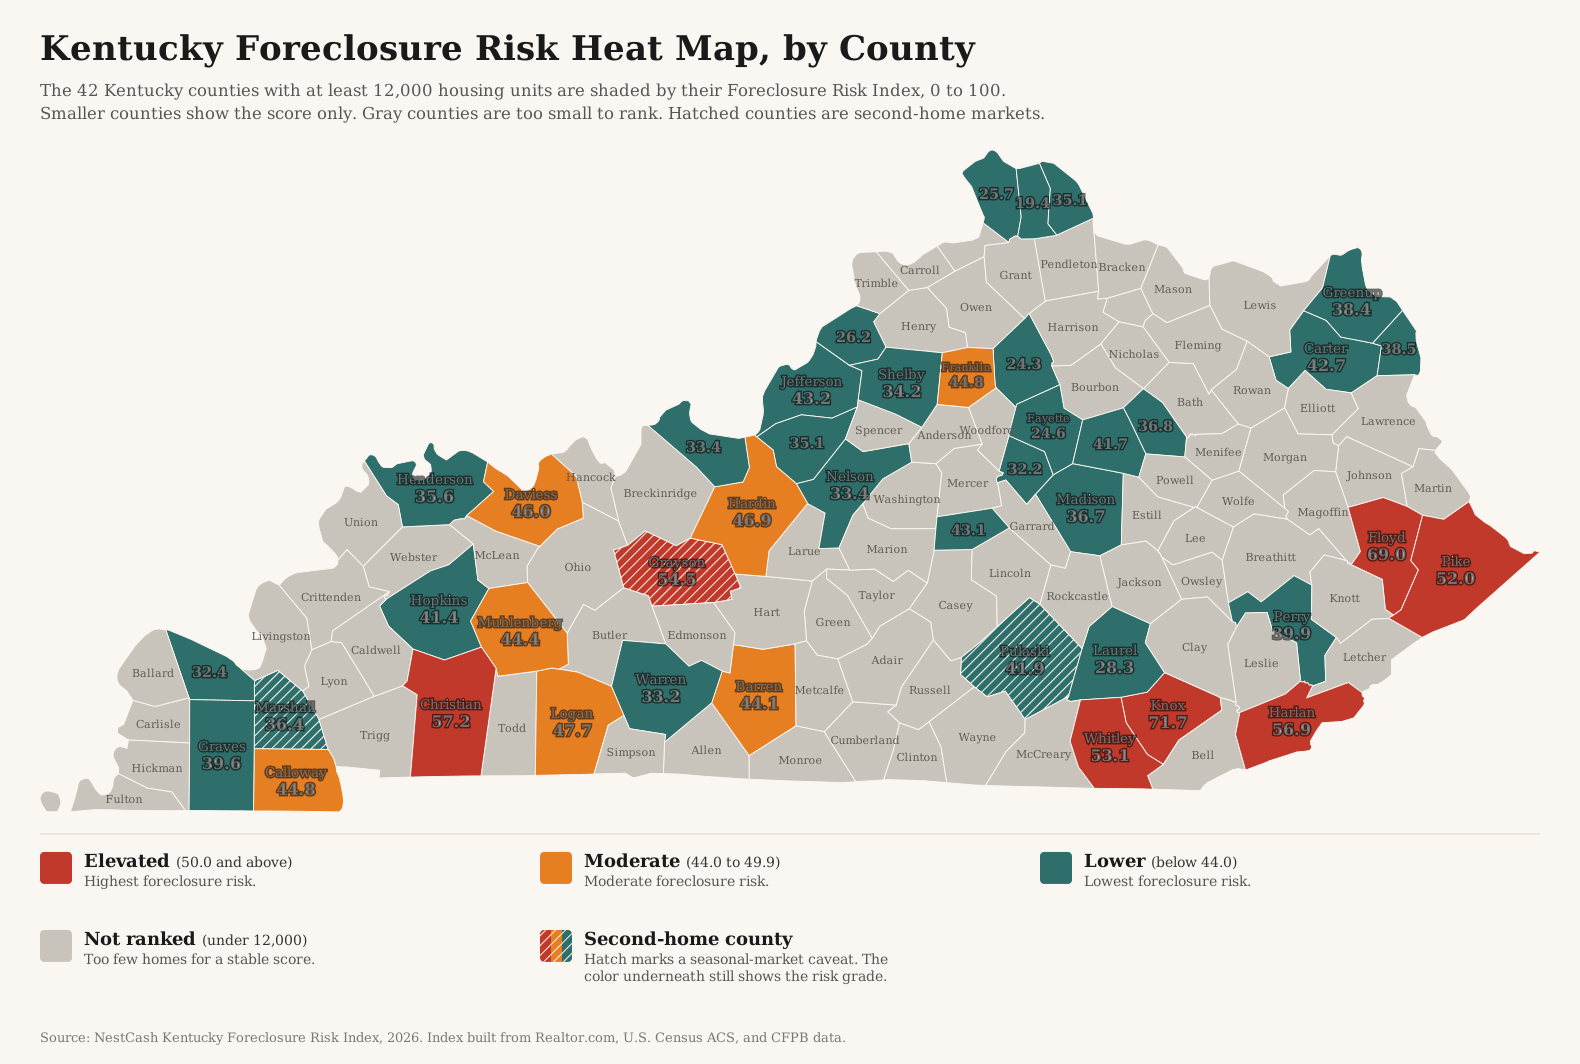
We built a county-level Foreclosure Risk Index from four public datasets to see where the pressure on homeowners is building. It is concentrated in Eastern Kentucky. Knox County ranks first and Floyd County second in every version of the index we tested, and Harlan, Whitley, and Pike counties also grade Elevated. Christian County, home to Hopkinsville next to Fort Campbell, ranks third, matching our Tennessee result for the other side of the base. Kentucky’s metro counties sit at the other end. Jefferson County (Louisville) grades Lower, just under the Moderate line, and Fayette County (Lexington) and Kenton County, the largest county in Northern Kentucky, rank near the bottom, with Kenton last at 19.4. Yet those metro counties are the ones ATTOM names in its Kentucky lists for zombie foreclosures and August filings, a contrast we explain below.
We score each county from 0 to 100 by blending four public signals, each weighted by how directly it bears on a mortgaged homeowner: market softness (35 percent), mortgage cost burden (30 percent), 90-day mortgage delinquency (20 percent), and unemployment (15 percent). Each signal is min-max normalized within Kentucky, so the score ranks counties against one another in the state, not against a national or absolute standard. A county grades Elevated at 50 or above, Moderate from 44 to 49.9, and Lower below 44. One rule keeps the ranking honest: we rank the 42 counties with at least 12,000 housing units. Kentucky has 120 counties, and the other 78 have too few homes for sale to score a market reliably, so they stay in the data but are not ranked. The 42 ranked counties hold 74.9 percent of the state’s homes. Because some of Kentucky’s results lean on inputs that need care, we tested the index five different ways and report which findings hold in all of them. The full weighting, the normalization, and the limits of the data are spelled out in the methodology section below.
Key findings
- Kentucky is mid-table on filings and high on vacant foreclosures. It ranked 32nd by foreclosure rate in the first half of 2026 and 30th in August, but 14th by the share of foreclosures that are vacant, 5.1 percent, in the third quarter (ATTOM Data Solutions).
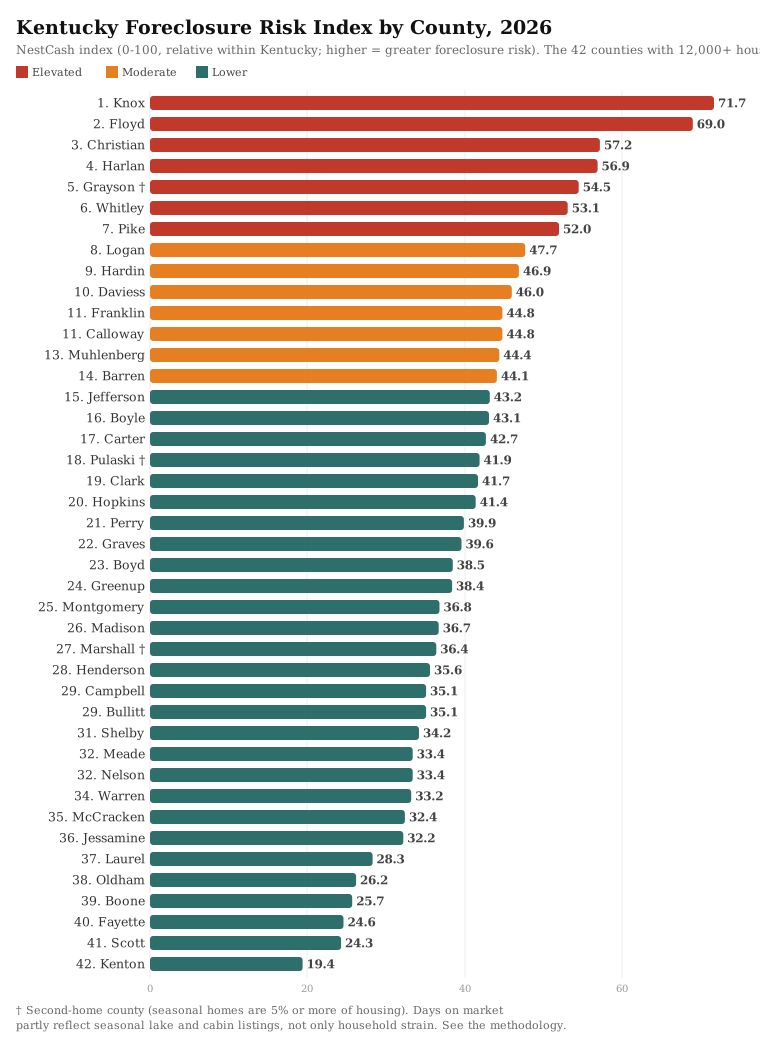
- Eastern Kentucky leads the index. Knox County (71.7) ranks first and Floyd County (69.0) second in all five versions of the index. Knox has the heaviest housing cost burden of any ranked county, 33.4 percent, and Floyd the second heaviest. Harlan (56.9), Whitley (53.1), and Pike (52.0) also grade Elevated, though less consistently.
- Fort Campbell is Elevated on both sides of the state line. Christian County, home to Hopkinsville, ranks third at 57.2 and grades Elevated in every version of the index. Across the line, Montgomery County, Tennessee, home to Clarksville, grades Elevated in our Tennessee index.
- Louisville, Lexington, and Northern Kentucky score low. Jefferson County grades Lower at 43.2, Fayette County scores 24.6, and Kenton County is last in the state at 19.4, with the lowest published delinquency rate in Kentucky, 0.5 percent.
- Hardin County is the one to watch. Home to Elizabethtown and much of Fort Knox, it grades Moderate at 46.9. Layoffs of roughly 1,500 workers were set to begin in February 2026 at a battery plant that was expected to bring 5,000 jobs.
Methodology
Three limits to read first
We state these before the method because they shape how the Kentucky results should be read.
Delinquency data for four of 42 ranked counties. The CFPB publishes a county’s 90-day delinquency rate only when the county has enough mortgages in its sample. In Kentucky, four ranked counties qualify: Jefferson, Fayette, Kenton, and Boone. The other 38, including every county in the Elevated tier, carry the statewide rate of 1.0 percent. Eastern Kentucky’s high scores therefore rest on cost burden, unemployment, and slow markets, not on a measured delinquency rate, and Knox and Floyd still rank first and second when delinquency is removed from the index entirely.
Many of the hardest-hit counties are too small to rank. Kentucky has 120 counties, and most of them are small. Much of Eastern Kentucky, including Breathitt, Knott, Letcher, Clay, Bell, Magoffin, Martin, Owsley, and Leslie counties, has fewer than 12,000 housing units and too few listings to score reliably. Knox, Floyd, Harlan, Whitley, and Pike are the Eastern Kentucky counties that grade Elevated, and their results should be read as a signal for the region around them, not as a claim that the counties next to them are unaffected.
Three lake counties. Median days on market is half of the market-softness input, and in second-home markets it is likely inflated by vacation homes that sit longer on the market. We flag counties where the Census counts 5 percent or more of homes as held for seasonal, recreational, or occasional use. Three ranked counties clear that line: Grayson (14.7 percent, Rough River and Nolin lakes), Marshall (8.5 percent), and Pulaski (8.2 percent, Lake Cumberland). Calloway County, at 3.2 percent, is the next ranked county below the line. Grayson County ranks fifth on the standard index and grades Elevated in every version of it, so its result does not rest on days on market alone, but we mark it with a dagger throughout.
We kept the standard formula anyway. Changing the method state by state would break the comparability that makes the series useful, and disclosing where the result is fragile is more useful to readers than tuning it away.
Data and sources
We built the index entirely from public and openly licensed data, and we cite each source at the point of use. Market conditions come from Realtor.com Economic Research (county listing data through September 2026). Housing tenure, mortgage status, cost burden, seasonal homes, county housing counts, and unemployment come from the U.S. Census Bureau’s American Community Survey five-year estimates (2020 to 2024). Mortgage delinquency comes from the Consumer Financial Protection Bureau’s Mortgage Performance Trends (latest data December 2025). Current county unemployment for the sensitivity test comes from the Bureau of Labor Statistics’ Local Area Unemployment Statistics. Statewide filing counts, national ranks, and trends come from ATTOM Data Solutions’ published foreclosure market reports. Every dataset we used is free and publicly available.
Building the index
The Kentucky Foreclosure Risk Index uses the same formula as every state in this series, a weighted blend of four signals, each chosen because it precedes or predicts foreclosure among homeowners who carry a mortgage:
35%
The share of active listings with a price cut and the median days a home sits on the market. A soft market matters because a homeowner in trouble who cannot sell quickly has fewer ways to avoid foreclosure. See the note on lake counties above.
30%
The share of owners with a mortgage who spend more than 30 percent of household income on housing. This is direct payment stress on the exact population that can be foreclosed on.
20%
The 90-day-or-more delinquency rate, the clearest early warning that foreclosures are coming. Published for four of Kentucky’s 42 ranked counties. See the note above.
15%
A secondary driver. We hold its weight down deliberately, because unemployment also captures renters and therefore dilutes a signal meant to describe homeowners.
We normalized each signal across the 42 ranked counties on a 0-to-1 scale, where 0 is the lowest value in that set and 1 is the highest, then applied the weights above and multiplied by 100. The result is a relative score: it ranks Kentucky counties against one another, not against a national or absolute standard. We then graded each county by its score, Elevated for 50.0 or above, Moderate for 44.0 to 49.9, and Lower for anything below 44.0. Seven counties land in the Elevated tier, seven in Moderate, and 28 in Lower. The seven Elevated counties hold 6.5 percent of the state’s homes.
To test how much the results depend on any one input, we scored the counties five ways: the standard index; the standard index with current Bureau of Labor Statistics unemployment, the 12 published months from August 2025 through August 2026, in place of the Census five-year estimate; the index with delinquency removed and its weight spread proportionally across the other three signals; the index with market softness measured by price cuts alone; and price cuts alone combined with current BLS unemployment. When we call a finding robust in this report, it holds in all five.
Other limitations
The index is relative. A Lower grade means lower measured risk than other Kentucky counties, not low risk in absolute terms. It also measures leading pressure, not completed foreclosures or filings, so it will not match any single month’s filing counts. ATTOM’s August 2026 state rankings listed Kenton, Jefferson, Franklin, and Boyd counties under Kentucky. Franklin, home to Frankfort, grades Moderate on our index at 44.8, and Boyd, home to Ashland, grades Lower. Counties that tie at the published one-decimal score share a rank.
Findings
The index
Ranked from most to least risk on the standard formula. Read the daggered lake counties with the limits above in mind.
Eastern Kentucky
Knox County, home to Barbourville, scores 71.7, the highest in Kentucky, and Floyd County, home to Prestonsburg, scores 69.0. They rank first and second in all five versions of the index, two of the most consistent results in this index. Their mortgaged owners carry the heaviest housing cost burdens of any ranked county, 33.4 percent in Knox and 29.7 percent in Floyd, and their five-year unemployment estimates, 8.1 and 7.7 percent, are the second and third highest of any ranked county. Both have improved since: their current 12-month rates are 6.0 and 5.9 percent, and they still rank first and second with them. Homes sit on the market a median of 87 days in Knox and 102 in Floyd.
Harlan County (56.9), Whitley County (53.1), and Pike County (52.0) also grade Elevated, but less firmly. Harlan has the highest five-year unemployment rate of any ranked county, 9.5 percent, and the slowest market, with homes sitting on the market a median of 140 days, but it falls to Moderate when market softness is measured by price cuts alone and to Lower when that is combined with current unemployment. Whitley has the highest share of listings with a price cut of any ranked county, 35.8 percent. Pike County ranks third when current BLS unemployment is used, and its current rate, 6.3 percent, is the second highest of any ranked county. Pike also ranks 16th of 1,129 U.S. counties on our Vacant & Abandoned Property Index, one of the Appalachian coal counties that index found carrying a high share of vacant homes held off the market, and Kentucky ranks 10th of the 50 states and the District of Columbia on that index.
Coal employment in the region has been falling for decades. Eastern Kentucky’s coal mines employed 8,123 people in the third quarter of 2013 and 2,093 in the first quarter of 2026 (Kentucky Energy and Environment Cabinet). In July 2022, floods across 13 Eastern Kentucky counties damaged or destroyed nearly 9,000 homes, most of them in Breathitt, Knott, Letcher, and Perry counties, which are too small to rank or, in Perry’s case, grade Lower (Federal Reserve Bank of Cleveland). Floyd, Pike, and Whitley were among the counties covered by that disaster declaration. Knox and Harlan were not, and Knox, which leads our index, now has almost no coal employment. Its score reflects household strain, not a single recent shock.
Fort Campbell and Hopkinsville
Christian County, home to Hopkinsville next to Fort Campbell, ranks third at 57.2 and grades Elevated in all five versions of the index, never ranking lower than fourth. Its owners carry the third-heaviest cost burden of any ranked county, 28.9 percent. The county’s population fell about 1.8 percent from July 2024 to July 2025, one of the larger declines in the country, even as local officials say the county is short of housing (Kentucky New Era). Military rotations can move both population counts and home listings in a base county, which may lift price cuts and days on market here. Across the state line, Montgomery County, home to Clarksville on the Tennessee side of the base, grades Elevated in our Tennessee Foreclosure Risk Index, with the highest delinquency rate in that state.
Fort Knox and the battery plant
Hardin County, home to Elizabethtown and much of Fort Knox, grades Moderate at 46.9 and rises to Elevated when market softness is measured by price cuts alone. Its outlook changed sharply in 2026. The BlueOval SK battery park, expected to create 5,000 jobs, began production in August 2025, and after Ford and SK agreed in December 2025 to dissolve their joint venture, layoffs of roughly 1,500 workers there were set to begin in February 2026 (Manufacturing Dive). A 2024 study had estimated that Hardin County would need more than 8,800 new homes to house the growth (Courier-Journal). Our index uses listing data through September 2026, so it captures the start of any adjustment, and Hardin is the county we will watch most closely in the next edition.
Louisville, Lexington, and Northern Kentucky
Kentucky’s metro counties score low on the index. Jefferson County, the largest in the state with 359,710 homes, grades Lower at 43.2, with a 1.0 percent delinquency rate, the same as the state. It rises to Elevated when market softness is measured by price cuts alone, so Louisville sits closer to the middle of the table than its rank suggests. Fayette County, home to Lexington, scores 24.6, and Kenton County is the lowest-scoring county in Kentucky at 19.4, with the lowest published delinquency rate in the state, 0.5 percent. Boone County, next door, has the highest published delinquency rate in Kentucky, 1.2 percent, but its fast market and low cost burden keep it near the bottom at 25.7.
Yet these are the counties ATTOM names. ATTOM’s Kentucky entry for third-quarter zombie foreclosures named Jefferson, Fayette, and Kenton, and Kenton and Jefferson were among the four counties it listed for August. Filings follow the number of mortgages, and the metro counties hold more than a third of them. Our index measures something different: how much strain the typical homeowner in a county is under, and how hard it would be to sell. In Kentucky the two point to different places, and both are worth watching.
How today compares with the last crisis
We do not show a history chart for Kentucky, because the published numbers for the last crisis do not measure it well. RealtyTrac’s 2009 year-end report ranked Kentucky 40th, with 9,682 properties receiving a foreclosure filing, 0.51 percent of homes against 2.21 percent nationally. But a 2009 study by the Kentucky Legislative Research Commission found that RealtyTrac’s coverage in Kentucky was limited to between 25 and 60 counties depending on the month, and concluded that studies relying on it “will almost certainly show Kentucky to be not nearly as affected by foreclosures as it is in reality.” Kentucky’s courts referred 16,665 foreclosure cases, residential and commercial, to master commissioners for sale in 2008, and the share of Kentucky mortgages entering foreclosure was higher than the national share every year from 2001 through 2007 (Legislative Research Commission). Kentucky’s foreclosure-start rate was running above the nation’s before the national crisis began.
The process has also changed. In the fourth quarter of 2011, Kentucky foreclosures took an average of 108 days, among the shortest in the country. By the fourth quarter of 2020 they took 1,390 days, the third longest, and in the fourth quarter of 2023 they took 1,643 days, the fifth longest (RealtyTrac and ATTOM year-end reports). Kentucky was not among the five longest or shortest in the second quarter of 2026.
If you are a Kentucky homeowner facing foreclosure
This report is a market analysis, not legal advice, but the data points to a few things worth knowing. Kentucky forecloses through the courts. The lender files suit in circuit court, and if the court orders a sale, the home is sold at public auction by the court’s master commissioner, usually at the courthouse door (KRS 426.700). The sale must be advertised in advance (KRS 426.560), and before it, two disinterested householders of the county appraise the home under oath (KRS 426.520). The court can also enter a judgment against you personally for the debt (KRS 426.005).
The appraisal matters. If the home sells for less than two-thirds of its appraised value, you have six months from the sale to redeem it by paying the sale price plus 10 percent a year in interest and the buyer’s reasonable costs for upkeep, taxes, and insurance. The buyer still takes possession right away (KRS 426.530). The period was one year until 2014, and some older guides still say so. Except for certain high-cost home loans, Kentucky law does not require a lender to attempt a workout before foreclosing (Legislative Research Commission), but you can keep trying with your servicer until the home is sold.
Free help is available. A HUD-approved housing counselor can review your options at no cost. Call (800) 569-4287 to find one near you (HUD), use the CFPB’s housing counselor search, or start with the Kentucky Homeownership Protection Center, run by Kentucky Housing Corporation. Kentucky’s four civil legal aid programs together cover all 120 counties (Legal Aid of the Bluegrass). In 37 counties of Eastern and south-central Kentucky, AppalReD Legal Aid takes applications at 1-866-277-5733 (AppalReD). Legal Aid of the Bluegrass takes applications at 859-431-8200. The Legal Aid Society serves Louisville and 14 nearby counties, and Kentucky Legal Aid serves 35 counties in western and south-central Kentucky. The Kentucky Department of Financial Institutions, which licenses mortgage lenders and loan officers, takes complaints at (502) 573-3390 or (800) 223-2579 (Kentucky Homeownership Protection Center). The state’s Team Kentucky Homeowner Assistance Fund stopped taking applications on June 30, 2025 (Kentucky Homeownership Protection Center). Be wary of anyone who charges up-front fees to stop a foreclosure or asks you to sign over the deed to your home.
The full data
All 42 ranked counties, from highest to lowest Foreclosure Risk Index. An asterisk on the delinquency rate marks a county where the Kentucky statewide rate was substituted because its own rate is not separately reported. A dagger marks a second-home county, where seasonal homes are 5 percent or more of housing. Unemployment is the five-year Census estimate used in the index. Counties that tie at the published score share a rank.
| Rank | County | FRI | Grade | Price cuts | Median DOM | Cost burden | 90+ delinq | Unemployment |
|---|---|---|---|---|---|---|---|---|
| 1 | Knox | 71.7 | Elevated | 21.8% | 87 | 33.4% | 1.0*% | 8.1% |
| 2 | Floyd | 69.0 | Elevated | 25.1% | 102 | 29.7% | 1.0*% | 7.7% |
| 3 | Christian | 57.2 | Elevated | 22.9% | 68 | 28.9% | 1.0*% | 6.3% |
| 4 | Harlan | 56.9 | Elevated | 20.6% | 140 | 19.4% | 1.0*% | 9.5% |
| 5 | Grayson † | 54.5 | Elevated | 18.9% | 83 | 27.4% | 1.0*% | 6.6% |
| 6 | Whitley | 53.1 | Elevated | 35.8% | 79 | 21.4% | 1.0*% | 5.4% |
| 7 | Pike | 52.0 | Elevated | 20.6% | 88 | 26.5% | 1.0*% | 5.2% |
| 8 | Logan | 47.7 | Moderate | 20.5% | 63 | 25.9% | 1.0*% | 5.7% |
| 9 | Hardin | 46.9 | Moderate | 24.8% | 59 | 23.0% | 1.0*% | 6.6% |
| 10 | Daviess | 46.0 | Moderate | 28.9% | 39 | 25.1% | 1.0*% | 4.5% |
| 11 | Franklin | 44.8 | Moderate | 24.5% | 57 | 23.0% | 1.0*% | 5.9% |
| 11 | Calloway | 44.8 | Moderate | 24.3% | 57 | 24.8% | 1.0*% | 4.4% |
| 13 | Muhlenberg | 44.4 | Moderate | 22.6% | 82 | 21.5% | 1.0*% | 5.7% |
| 14 | Barren | 44.1 | Moderate | 25.4% | 66 | 23.5% | 1.0*% | 4.1% |
| 15 | Jefferson | 43.2 | Lower | 24.9% | 41 | 24.2% | 1.0% | 5.2% |
| 16 | Boyle | 43.1 | Lower | 27.4% | 61 | 20.6% | 1.0*% | 5.8% |
| 17 | Carter | 42.7 | Lower | 15.9% | 68 | 25.1% | 1.0*% | 5.3% |
| 18 | Pulaski † | 41.9 | Lower | 20.6% | 80 | 22.1% | 1.0*% | 4.9% |
| 19 | Clark | 41.7 | Lower | 25.4% | 62 | 22.2% | 1.0*% | 4.4% |
| 20 | Hopkins | 41.4 | Lower | 17.4% | 50 | 24.4% | 1.0*% | 6.2% |
| 21 | Perry | 39.9 | Lower | 13.2% | 54 | 25.4% | 1.0*% | 5.8% |
| 22 | Graves | 39.6 | Lower | 25.3% | 55 | 22.9% | 1.0*% | 3.4% |
| 23 | Boyd | 38.5 | Lower | 24.6% | 64 | 18.3% | 1.0*% | 6.4% |
| 24 | Greenup | 38.4 | Lower | 19.8% | 57 | 20.4% | 1.0*% | 6.8% |
| 25 | Montgomery | 36.8 | Lower | 21.7% | 47 | 22.9% | 1.0*% | 4.0% |
| 26 | Madison | 36.7 | Lower | 23.5% | 52 | 20.4% | 1.0*% | 5.1% |
| 27 | Marshall † | 36.4 | Lower | 21.3% | 58 | 21.3% | 1.0*% | 4.5% |
| 28 | Henderson | 35.6 | Lower | 18.5% | 40 | 26.0% | 1.0*% | 2.5% |
| 29 | Campbell | 35.1 | Lower | 22.3% | 50 | 21.5% | 1.0*% | 4.0% |
| 29 | Bullitt | 35.1 | Lower | 22.7% | 45 | 21.4% | 1.0*% | 4.3% |
| 31 | Shelby | 34.2 | Lower | 21.4% | 45 | 21.6% | 1.0*% | 4.2% |
| 32 | Meade | 33.4 | Lower | 24.7% | 67 | 17.1% | 1.0*% | 4.8% |
| 32 | Nelson | 33.4 | Lower | 20.8% | 49 | 22.1% | 1.0*% | 3.3% |
| 34 | Warren | 33.2 | Lower | 24.6% | 60 | 18.1% | 1.0*% | 4.4% |
| 35 | McCracken | 32.4 | Lower | 20.2% | 59 | 21.0% | 1.0*% | 3.2% |
| 36 | Jessamine | 32.2 | Lower | 20.9% | 58 | 20.8% | 1.0*% | 3.1% |
| 37 | Laurel | 28.3 | Lower | 17.9% | 74 | 18.0% | 1.0*% | 3.5% |
| 38 | Oldham | 26.2 | Lower | 19.9% | 47 | 18.5% | 1.0*% | 3.5% |
| 39 | Boone | 25.7 | Lower | 18.7% | 36 | 17.1% | 1.2% | 3.1% |
| 40 | Fayette | 24.6 | Lower | 20.4% | 43 | 20.8% | 0.7% | 4.9% |
| 41 | Scott | 24.3 | Lower | 12.9% | 57 | 18.5% | 1.0*% | 4.3% |
| 42 | Kenton | 19.4 | Lower | 21.6% | 44 | 21.2% | 0.5% | 4.3% |
Seventy-eight counties are not ranked because they fall below the 12,000-housing-unit floor: Adair, Allen, Anderson, Ballard, Bath, Bell, Bourbon, Bracken, Breathitt, Breckinridge, Butler, Caldwell, Carlisle, Carroll, Casey, Clay, Clinton, Crittenden, Cumberland, Edmonson, Elliott, Estill, Fleming, Fulton, Gallatin, Garrard, Grant, Green, Hancock, Harrison, Hart, Henry, Hickman, Jackson, Johnson, Knott, Larue, Lawrence, Lee, Leslie, Letcher, Lewis, Lincoln, Livingston, Lyon, Magoffin, Marion, Martin, Mason, McCreary, McLean, Menifee, Mercer, Metcalfe, Monroe, Morgan, Nicholas, Ohio, Owen, Owsley, Pendleton, Powell, Robertson, Rockcastle, Rowan, Russell, Simpson, Spencer, Taylor, Todd, Trigg, Trimble, Union, Washington, Wayne, Webster, Wolfe, and Woodford.
What we will watch
We plan to update this index quarterly, beginning with the first quarter of 2027. Three things will tell us where Kentucky goes from here: whether the statewide delinquency rate, which rose from 0.9 percent to 1.0 percent in 2025, keeps climbing; whether Hardin County’s market softens further as the battery plant winds down; and whether Kentucky’s high share of vacant foreclosures in Louisville, Lexington, and Northern Kentucky holds.
Sources and data
- Foreclosure activity and trend. ATTOM Data Solutions, 2026 Mid-Year U.S. Foreclosure Market Report, U.S. Foreclosure Rates by State, August 2026 (published September 18, 2026), and Zombie Foreclosure Rates by State, Q3 2026 (published September 4, 2026). Used for statewide filing counts, national ranks, the one-year and two-year changes, and the counties named for August filing rates and third-quarter zombie foreclosures.
- Historical record and timelines. RealtyTrac, 2009 Year-End Foreclosure Market Report (via the Financial Crisis Inquiry Commission archive); Kentucky Legislative Research Commission, Research Report 365 (2009), for RealtyTrac’s Kentucky coverage, 2008 master commissioner referrals, and foreclosure starts from 2001 through 2007; and the RealtyTrac and ATTOM year-end reports for 2011, 2020, and 2023 for Kentucky’s fourth-quarter foreclosure timelines.
- Housing market softness. Realtor.com Economic Research, county inventory core metrics through September 2026.
- Housing, mortgage status, cost burden, seasonal homes, and unemployment. U.S. Census Bureau, American Community Survey five-year estimates, 2020 to 2024.
- Current unemployment. U.S. Bureau of Labor Statistics, Local Area Unemployment Statistics, the 12 published months from August 2025 through August 2026 (BLS published no October 2025 figures). Used only for the sensitivity test.
- Mortgage delinquency. CFPB Mortgage Performance Trends, state and county data through December 2025. Used for the 90-or-more day delinquency rates and the national and state comparisons.
- County context. Kentucky Energy and Environment Cabinet, Quarterly Coal Report, first quarter 2026; Federal Reserve Bank of Cleveland, Resilience and Recovery (2023), on the July 2022 floods; Kentucky New Era (March 31, 2026) on Christian County; Manufacturing Dive (March 23, 2026) on the BlueOval SK layoffs; and the Courier-Journal’s 2024 reporting, as republished by the Elizabethtown-Hardin County Industrial Foundation, on Hardin County’s housing plans.
- Foreclosure process. Kentucky Revised Statutes 426.005, 426.520, 426.530, 426.560, and 426.700, and the Kentucky Homeownership Protection Center. Help resources from HUD, AppalReD Legal Aid, Legal Aid of the Bluegrass, the Legal Aid Society, and Kentucky Legal Aid.
About NestCash
NestCash buys houses for cash in twelve states and publishes original housing and distressed-property research across U.S. markets. Our original housing research helps homeowners, buyers, and investors understand local market conditions. This report may be cited and its charts embedded with attribution to NestCash.

John is the Founder of NestCash and a leading voice in real estate investing and housing market strategy. With experience across 12 states, he helps buyers, sellers, and investors make smarter decisions using real-world insight and market data.