

The 2026 Maryland Foreclosure Risk Index
Where financial pressure on Maryland homeowners is building, county by county
 Published on October 5th, 2026, by John Carter | Founder, NestCash
Original NestCash research, free to read and cite.

Abstract
Maryland’s foreclosure pressure is rising faster than the nation’s. In the first half of 2026 the state recorded 4,985 foreclosure filings, one for every 514 housing units, the ninth-highest rate in the country. Filings were up 36 percent from the first half of 2025, against a national increase of 21 percent, and by August Maryland had the fifth-worst foreclosure rate of any state (ATTOM Data Solutions). It is a familiar position. Maryland foreclosures must be filed in court, and after the last crisis the state’s foreclosures stretched out over years: it had one of the four highest foreclosure rates in the nation every year from 2013 through 2020.
We built a county-level Foreclosure Risk Index from four public datasets to see where that pressure sits now. Baltimore City ranks first by nine points. It has the highest mortgage delinquency rate in the state, 2.4 percent, and it scores highest in four of the five versions of the index we tested. The next cluster is the southern Washington suburbs: Prince George’s County and Charles County both grade Elevated in every version, on the second- and third-highest delinquency rates in Maryland. The Eastern Shore also scores high, but there the results rest on seasonal second-home markets and estimated delinquency data, and we treat them with more caution. The safest ground is the affluent central corridor of Howard and Carroll counties, along with St. Mary’s County in southern Maryland.
ATTOM’s own county data points the same way at the top. The Maryland jurisdictions with the worst foreclosure filing rates in August 2026 were Baltimore City, Charles, Allegany, and Calvert.
We score each county from 0 to 100 by blending four public signals, each weighted by how directly it bears on a mortgaged homeowner: market softness (35 percent), mortgage cost burden (30 percent), 90-day mortgage delinquency (20 percent), and unemployment (15 percent). Each signal is min-max normalized within Maryland, so the score ranks counties against one another in the state, not against a national or absolute standard. A county grades Elevated at 50 or above, Moderate from 44 to 49.9, and Lower below 44. One rule keeps the ranking honest: we rank the 22 jurisdictions with at least 12,000 housing units. Maryland has 23 counties plus Baltimore City, which is counted separately from Baltimore County. Kent and Somerset counties, both on the Eastern Shore, have too few homes to score their markets reliably, so they stay in the data but are not ranked. Because some of Maryland’s results lean on inputs that need care, we tested the index five different ways and report which findings hold in all of them. The full weighting, the normalization, and the limits of the data are spelled out in the methodology section below.
Key findings
- Maryland’s foreclosures are rising faster than the nation’s. The state ranked ninth by foreclosure rate in the first half of 2026, with 4,985 filings, up 36 percent from a year earlier against a national rise of 21 percent. In August it had the fifth-worst rate in the country, one filing for every 2,530 housing units (ATTOM Data Solutions).
- Baltimore City is the finding that holds. It scores 78.2, nine points clear of the next jurisdiction, and it grades Elevated in all five versions of the index we tested. Its 2.4 percent rate of mortgages 90 or more days delinquent is the highest in Maryland. The Baltimore metro had 167 completed foreclosures in August 2026, the fifth most of any U.S. metro.
- The southern Washington suburbs come next. Prince George’s County (67.5) and Charles County (60.9) grade Elevated in every version of the index, on the second- and third-highest delinquency rates in the state, 1.8 and 1.7 percent. Prince George’s is the second-largest county in Maryland by housing.
- The Eastern Shore scores high, but less reliably. Five Eastern Shore counties grade Elevated, led by Worcester, home to Ocean City (68.5). None of the five has a published delinquency rate of its own, three are second-home markets, and two of them, Dorchester and Talbot, fall to Lower when slow seasonal sales are taken out of the index.
- Maryland has been here before. It had one of the four highest foreclosure rates in the nation every year from 2013 through 2020, and its 2026 pace is above its 2024 and 2025 rates (ATTOM Data Solutions).
Methodology
Two limits to read first
We state these before the method because they shape how the Maryland results should be read.
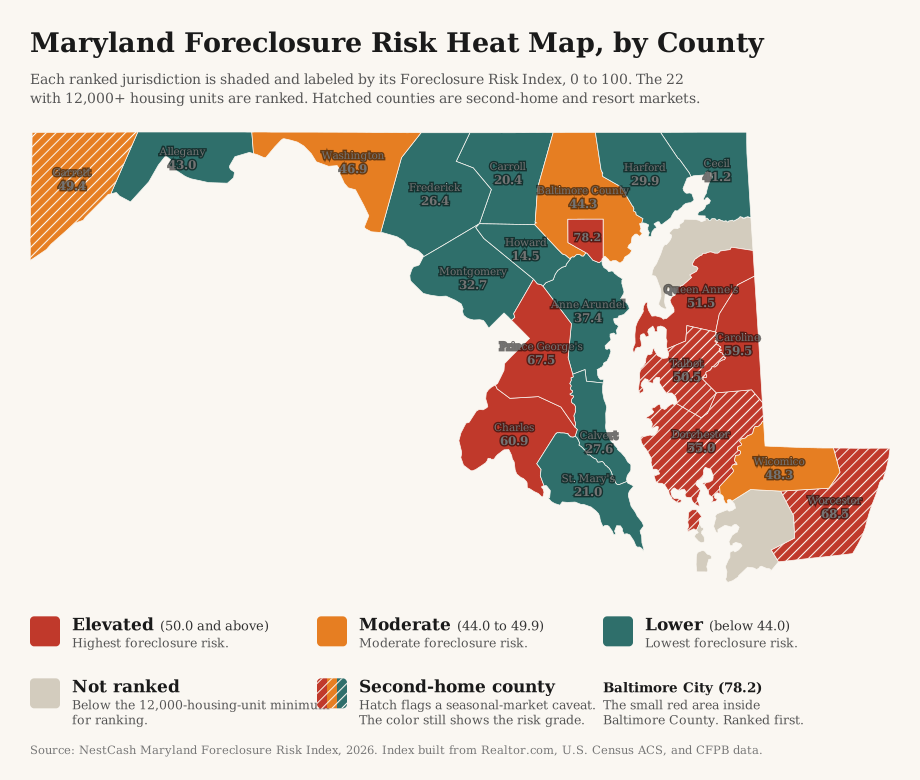
Second-home counties. Median days on market is half of the market-softness input, and in Maryland’s resort and waterfront counties it is inflated by seasonal inventory: beach condos, lake houses, and waterfront homes that take longer to sell for reasons unrelated to household strain. To flag these counties by rule rather than judgment, we used the Census count of homes held for seasonal, recreational, or occasional use. Statewide, 2.1 percent of Maryland’s homes fall in that category. Four ranked counties are at 5 percent or more, the cutoff we use across this series: Worcester (52.6 percent, Ocean City), Garrett (22.2 percent, Deep Creek Lake), Talbot (8.4 percent), and Dorchester (6.6 percent). Queen Anne’s County is just under the line at 4.5 percent and is not flagged. The four are hatched on the map and marked with a dagger in the chart and table, the same treatment we gave the Shore counties in our New Jersey index and the mountain resort counties in our Colorado index.
The flag matters a great deal for three of the four. Scored on price cuts alone, without days on market, Dorchester falls from 55.0 to 41.2, Talbot from 50.5 to 40.2, and Garrett from 49.4 to 34.7, all of them Lower. Worcester holds up better, at 64.0, because its owners carry the second-highest cost burden in the state, 33.2 percent. In resort counties that figure can reflect second-home owners whose housing costs are high relative to reported local income, the pattern we found in Colorado, so we would not read Worcester’s rank as evidence of local household distress.
Delinquency data for 13 of 22 jurisdictions. The CFPB publishes a county’s 90-day delinquency rate only when the county has enough mortgages in its sample. In Maryland, 13 of the 22 ranked jurisdictions qualify. The other nine, which include every ranked Eastern Shore county, carry the statewide rate of 1.1 percent. The three jurisdictions at the top of our robust findings, Baltimore City, Prince George’s, and Charles, all have published rates of their own, and all three are well above the statewide figure.
We kept the standard formula anyway. Changing the method state by state would break the comparability that makes the series useful, and disclosing where the result is fragile is more useful to readers than tuning it away.
Data and sources
We built the index entirely from public and openly licensed data, and we cite each source at the point of use. Market conditions come from Realtor.com Economic Research (county listing data through September 2026). Housing tenure, mortgage status, cost burden, seasonal homes, county housing counts, and unemployment come from the U.S. Census Bureau’s American Community Survey five-year estimates (2020 to 2024). Mortgage delinquency comes from the Consumer Financial Protection Bureau’s Mortgage Performance Trends (latest data December 2025). Current county unemployment for the sensitivity test comes from the Bureau of Labor Statistics’ Local Area Unemployment Statistics. Statewide filing counts, national ranks, and trends come from ATTOM Data Solutions’ published foreclosure market reports. Every dataset we used is free and publicly available.
Building the index
The Maryland Foreclosure Risk Index uses the same formula as every state in this series, a weighted blend of four signals, each chosen because it precedes or predicts foreclosure among homeowners who carry a mortgage:
35%
The share of active listings with a price cut and the median days a home sits on the market. A soft market matters because a homeowner in trouble who cannot sell quickly has fewer ways to avoid foreclosure. See the note on second-home counties above.
30%
The share of owners with a mortgage who spend more than 30 percent of household income on housing. This is direct payment stress on the exact population that can be foreclosed on.
20%
The 90-day-or-more delinquency rate, the clearest early warning that foreclosures are coming. Published for 13 of Maryland’s 22 ranked jurisdictions. See the note above.
15%
A secondary driver. We hold its weight down deliberately, because unemployment also captures renters and therefore dilutes a signal meant to describe homeowners.
We normalized each signal across the 22 ranked jurisdictions on a 0-to-1 scale, where 0 is the lowest value in that set and 1 is the highest, then applied the weights above and multiplied by 100. The result is a relative score: it ranks Maryland jurisdictions against one another, not against a national or absolute standard. We then graded each one by its score, Elevated for 50.0 or above, Moderate for 44.0 to 49.9, and Lower for anything below 44.0. Eight jurisdictions land in the Elevated tier, four in Moderate, and 10 in Lower. The eight Elevated jurisdictions hold 33.3 percent of the state’s homes, mostly because Baltimore City and Prince George’s County are among the largest housing markets in Maryland.
To test how much the results depend on any one input, we scored the jurisdictions five ways: the standard index; the standard index with current Bureau of Labor Statistics unemployment, the 12 published months from August 2025 through August 2026, in place of the Census five-year estimate; the index with delinquency removed and its weight spread proportionally across the other three signals; the index with market softness measured by price cuts alone; and price cuts alone combined with current BLS unemployment. When we call a finding robust in this report, it holds in all five.
Other limitations
The index is relative. A Lower grade means lower measured risk than other Maryland jurisdictions, not low risk in absolute terms. It also measures leading pressure, not completed foreclosures or filings, so it will not match any single month’s filing counts. ATTOM named Allegany and Calvert among the four Maryland jurisdictions with the worst filing rates in August 2026, and both grade Lower on the standard index. Allegany has the heaviest price cutting in the state, 25.0 percent of listings, and it rises to Elevated when market softness is measured by price cuts alone. Several smaller counties had thin listing data in September 2026, most of all Caroline County, with 109 active listings, so their market-softness figures carry more noise than the larger counties’. Jurisdictions that tie at the published one-decimal score would share a rank. None do in this edition.
Findings
The index
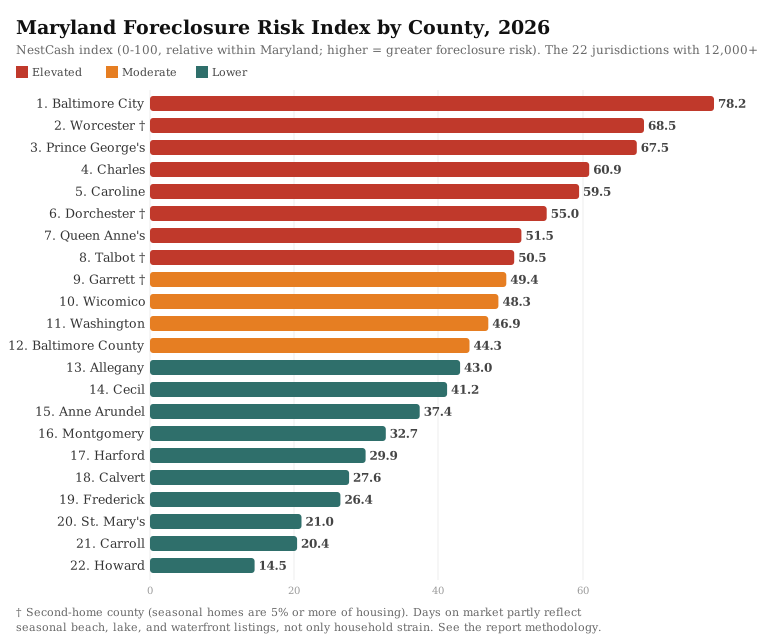
Ranked from most to least risk on the standard formula. Read the daggered second-home counties with the limits above in mind.
Baltimore City: the finding that holds
Baltimore City scores 78.2, the highest in Maryland and 9.7 points ahead of the next jurisdiction. It ranks first in four of the five versions of the index and second in the fifth, and it does not depend on any single input. Its 2.4 percent rate of mortgages 90 or more days delinquent is the highest in the state, its owners carry a 32.6 percent housing cost burden, a fifth of its listings carried a price cut in September 2026, and the typical home sat 62 days on the market. Its current unemployment rate, 5.7 percent over the latest 12 months, is tied with Allegany County for the highest in Maryland. Baltimore City also ranks 24th of 1,129 counties nationally on our Vacant & Abandoned Property Index, where 8.7 percent of its homes sit vacant and off the market.
The filing data agrees. Baltimore City was first on ATTOM’s list of the Maryland jurisdictions with the worst foreclosure filing rates in August 2026, and the Baltimore metro recorded 167 completed foreclosures that month, the fifth most of any U.S. metro (ATTOM Data Solutions). Baltimore County, which surrounds the city, grades Moderate at 44.3, and on price cuts alone it rises to 56.1, Elevated.
The southern Washington suburbs
Prince George’s County ranks third at 67.5 and Charles County fourth at 60.9, and both grade Elevated in every version of the index we ran. They have the second- and third-highest delinquency rates in Maryland, 1.8 and 1.7 percent, both published county rates, and owners in both carry housing cost burdens above 32 percent. Prince George’s, with 365,506 homes, is the second-largest county in the state by housing. Charles also appeared on ATTOM’s August list of the Maryland jurisdictions with the worst filing rates.
There is one sign of relief. In August 2026 the Washington metro, which includes both counties, recorded one of the largest year-over-year declines in foreclosure starts of any large U.S. metro, from 364 to 227 (ATTOM Data Solutions). Their neighbors look nothing alike. Montgomery County, the largest county in Maryland by housing, scores 32.7, and its delinquency rate, 0.4 percent, is tied for the lowest in the state.
The Eastern Shore
Worcester County, home to Ocean City, ranks second at 68.5, and four more Eastern Shore counties grade Elevated: Caroline (59.5), Dorchester (55.0), Queen Anne’s (51.5), and Talbot (50.5). We read this cluster with more caution than the western one. None of the five has a published delinquency rate of its own. Worcester, Dorchester, and Talbot are second-home counties, and Dorchester and Talbot fall to Lower when the index drops days on market. Caroline County has the highest housing cost burden in the state, 33.6 percent, and stays Elevated in four of the five versions of the index, but its market figures rest on only 109 active listings. Queen Anne’s grades Elevated on a 21.4 percent price-cut share and slow sales, a median of 62 days, but it slips to Moderate when current unemployment replaces the five-year estimate.
Wicomico County, home to Salisbury, grades Moderate at 48.3. Kent and Somerset counties are below our 12,000-home floor and are not ranked.
Western Maryland and the safest ground
Garrett County, around Deep Creek Lake, grades Moderate at 49.4 on the slowest market in the state, a median of 101 days, but falls to Lower on price cuts alone. Washington County, home to Hagerstown, grades Moderate at 46.9, with a 1.5 percent delinquency rate, the fourth highest in the state, and it rises to Elevated on price cuts alone. Allegany County, home to Cumberland, grades Lower at 43.0 on the standard index despite the heaviest price cutting in Maryland.
The safest ground in Maryland is the central corridor between Baltimore and Washington and southern Maryland’s St. Mary’s County. Howard County is the lowest-scoring jurisdiction in the state at 14.5, with the fastest market, a median of 35 days on market, and a delinquency rate of 0.4 percent, tied for the lowest. Carroll County (20.4) shares that 0.4 percent rate, and St. Mary’s County (21.0) has the lowest housing cost burden in the state, 18.6 percent. Calvert County, at 27.6, has the lowest unemployment rate in the state on the five-year estimate, 2.7 percent, even though ATTOM named it among the Maryland counties with the worst filing rates in August.
How today compares with the last crisis
Maryland’s foreclosure crisis outlasted the nation’s, the same pattern we found in New Jersey. In 2009, 43,248 Maryland properties received a foreclosure filing, 1.87 percent of the state’s housing, against 2.21 percent nationally, which ranked Maryland 13th among the states (RealtyTrac). That is the highest Maryland rate we could verify. The state’s rates for 2010 through 2012 were not published in the year-end reports we could verify, so the chart leaves those years blank.
By 2013, when the national rate had fallen to 1.04 percent, Maryland’s was 1.57 percent, and activity had more than doubled from the year before. ATTOM ranked Maryland fourth that year. From 2014 through 2019 it was third in every year’s ranking, with rates close to double the national level, and it was fourth again in 2020. Like New Jersey, Maryland requires every foreclosure to be filed in court, which helps explain why its post-crash foreclosures were spread over so many years.
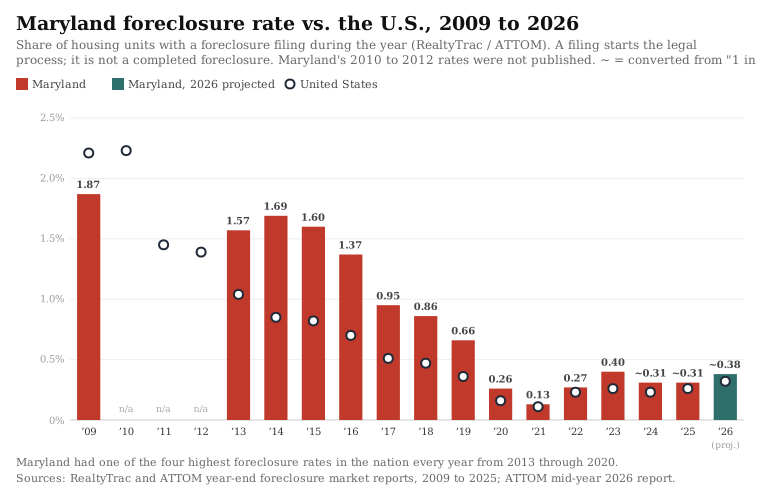
At its first-half pace, Maryland is on track for a foreclosure rate of roughly 0.38 percent of homes in 2026, above its 2024 and 2025 rates and above the national pace. Maryland’s rate has been above the national rate in every year from 2013 on. A filing marks the start of the legal process, not a completed foreclosure, and the 2026 figure doubles the first-half rate, so it is an approximation.
If you are a Maryland homeowner facing foreclosure
This report is a market analysis, not legal advice, but the data points to a few things worth knowing. In Maryland, a lender must send you a Notice of Intent to Foreclose before it can file, and the foreclosure case, called an Order to Docket, can be filed in circuit court any time after 45 days from when that notice was sent. You can stop the foreclosure by paying what is past due, including penalties and fees, up to one business day before the sale (Maryland People’s Law Library).
Maryland offers foreclosure mediation, a meeting with your lender and a neutral mediator from the state’s Office of Administrative Hearings to look for an alternative to foreclosure. To qualify, the home must be your primary residence, and you must request mediation within 25 days of receiving the lender’s final loss mitigation affidavit, with a $50 fee. If you miss the deadline, you will not get another chance at mediation. After a sale, you can file objections with the court within 30 days of the clerk’s notice, before the court ratifies the sale.
Free help is available. The Maryland Department of Housing and Community Development runs a foreclosure prevention line at 877-462-7555 and lists HUD-approved housing counselors and legal services providers by county on its foreclosure prevention page. The Maryland Legal Aid Bureau offers free legal help statewide at 888-213-3320, and you can also find a counselor through the CFPB’s housing counselor search. The state warns against anyone who charges up-front fees to stop a foreclosure or asks you to sign over the deed to your home.
The full data
All 22 ranked jurisdictions, from highest to lowest Foreclosure Risk Index. An asterisk on the delinquency rate marks a jurisdiction where the Maryland statewide rate was substituted because its own rate is not separately reported. A dagger marks a second-home county, where seasonal homes are 5 percent or more of housing and days on market partly reflect seasonal listings. Unemployment is the five-year Census estimate used in the index. See the limits at the start of the methodology.
| Rank | County | FRI | Grade | Price cuts | Median DOM | Cost burden | 90+ delinq | Unemployment |
|---|---|---|---|---|---|---|---|---|
| 1 | Baltimore City | 78.2 | Elevated | 20.9% | 62 | 32.6% | 2.4% | 6.5% |
| 2 | Worcester † | 68.5 | Elevated | 19.8% | 76 | 33.2% | 1.1*% | 6.7% |
| 3 | Prince George’s | 67.5 | Elevated | 21.0% | 48 | 32.2% | 1.8% | 6.4% |
| 4 | Charles | 60.9 | Elevated | 21.5% | 44 | 32.4% | 1.7% | 4.8% |
| 5 | Caroline | 59.5 | Elevated | 18.6% | 63 | 33.6% | 1.1*% | 5.7% |
| 6 | Dorchester † | 55.0 | Elevated | 17.4% | 92 | 28.8% | 1.1*% | 5.7% |
| 7 | Queen Anne’s | 51.5 | Elevated | 21.4% | 62 | 30.3% | 1.1*% | 3.8% |
| 8 | Talbot † | 50.5 | Elevated | 16.8% | 74 | 32.2% | 1.1*% | 4.3% |
| 9 | Garrett † | 49.4 | Moderate | 18.1% | 101 | 26.5% | 1.1*% | 4.4% |
| 10 | Wicomico | 48.3 | Moderate | 21.6% | 64 | 24.3% | 1.1*% | 5.9% |
| 11 | Washington | 46.9 | Moderate | 24.3% | 46 | 24.3% | 1.5% | 4.2% |
| 12 | Baltimore County | 44.3 | Moderate | 22.8% | 39 | 25.2% | 1.3% | 4.9% |
| 13 | Allegany | 43.0 | Lower | 25.0% | 61 | 20.1% | 1.1*% | 5.0% |
| 14 | Cecil | 41.2 | Lower | 19.4% | 49 | 25.8% | 1.1*% | 5.5% |
| 15 | Anne Arundel | 37.4 | Lower | 24.9% | 38 | 24.4% | 0.8% | 3.7% |
| 16 | Montgomery | 32.7 | Lower | 21.0% | 40 | 25.7% | 0.4% | 4.9% |
| 17 | Harford | 29.9 | Lower | 22.8% | 37 | 22.8% | 0.8% | 3.8% |
| 18 | Calvert | 27.6 | Lower | 20.6% | 45 | 24.5% | 0.9% | 2.7% |
| 19 | Frederick | 26.4 | Lower | 21.3% | 37 | 23.1% | 0.9% | 3.3% |
| 20 | St. Mary’s | 21.0 | Lower | 19.5% | 42 | 18.6% | 1.4% | 3.6% |
| 21 | Carroll | 20.4 | Lower | 20.6% | 36 | 23.1% | 0.4% | 3.5% |
| 22 | Howard | 14.5 | Lower | 19.3% | 35 | 21.7% | 0.4% | 3.5% |
Two counties are not ranked because they fall below the 12,000-housing-unit floor: Kent and Somerset.
What we will watch
We plan to update this index quarterly, beginning with the first quarter of 2027. Three things will tell us where Maryland goes from here: whether Baltimore City’s delinquency rate, already the highest in the state, keeps climbing; whether the drop in foreclosure starts across the Washington metro holds and begins to pull Prince George’s and Charles counties down the index; and whether the CFPB begins publishing delinquency rates for the Eastern Shore counties, which would let us replace the statewide substitute and test that cluster properly.
Sources and data
- Foreclosure activity and trend. ATTOM Data Solutions, 2026 Mid-Year U.S. Foreclosure Market Report, August 2026 U.S. Foreclosure Market Report, and U.S. Foreclosure Rates by State, August 2026 (published September 18, 2026). Used for statewide filing counts, national ranks, the year-over-year change, Baltimore metro completed foreclosures, Washington metro foreclosure starts, and the jurisdictions with the worst August filing rates.
- Housing market softness. Realtor.com Economic Research, county inventory core metrics through September 2026. Used for the price-cut share, median days on market, and active listing counts.
- Housing, mortgage status, cost burden, seasonal homes, and unemployment. U.S. Census Bureau, American Community Survey five-year estimates, 2020 to 2024. Used for county housing counts, the mortgaged-owner universe, housing cost burden, the seasonal-home share behind the second-home flag, and the unemployment rate in the index.
- Current unemployment. U.S. Bureau of Labor Statistics, Local Area Unemployment Statistics, county unemployment rates, the 12 published months from August 2025 through August 2026 (BLS published no October 2025 figures). Used only for the sensitivity test, not in the standard index.
- Mortgage delinquency. CFPB Mortgage Performance Trends, data through December 2025. Used for the 90-or-more day delinquency rates.
- Historical foreclosure rates. RealtyTrac, 2009 Year-End Foreclosure Market Report (via the Financial Crisis Inquiry Commission archive), and the RealtyTrac and ATTOM year-end U.S. foreclosure market reports for 2010 through 2025, including ATTOM’s 2018 and 2025 reports. Used for Maryland’s annual foreclosure rates and ranks. Most annual ranks after 2013 are taken from the order of ATTOM’s published state rankings. The 2024 and 2025 rates are converted from ATTOM’s published “one in every X housing units” figures, and 2026 is a full-year projection from the first-half rate.
- Foreclosure process. Maryland People’s Law Library, Foreclosure Steps and Timeline and Maryland Department of Housing and Community Development, Foreclosure Prevention. Used for the notice, filing, mediation, cure, and post-sale rules and the help lines.
About NestCash
NestCash buys houses for cash in twelve states and publishes original housing and distressed-property research across U.S. markets. Our original housing research helps homeowners, buyers, and investors understand local market conditions. This report may be cited and its charts embedded with attribution to NestCash.

John is the Founder of NestCash and a leading voice in real estate investing and housing market strategy. With experience across 12 states, he helps buyers, sellers, and investors make smarter decisions using real-world insight and market data.