

The 2026 New Jersey Foreclosure Risk Index
Where financial pressure on New Jersey homeowners is building, county by county
 Published on October 2nd, 2026, by John Carter | Founder, NestCash
Original NestCash research, free to read and cite.
Abstract
New Jersey has one of the longest foreclosure memories in the country. When the national crisis faded after 2010, New Jersey’s did not. Because every foreclosure in the state goes through the courts, the backlog from the crash took years to clear, and New Jersey had the highest foreclosure rate in the nation every year from 2015 through 2019, and again in 2023 (ATTOM Data Solutions). In the first half of 2026 the state recorded 8,269 foreclosure filings, one for every 459 housing units, the seventh-highest rate in the country. Filings were up 21 percent from the first half of 2025, in line with the national increase.
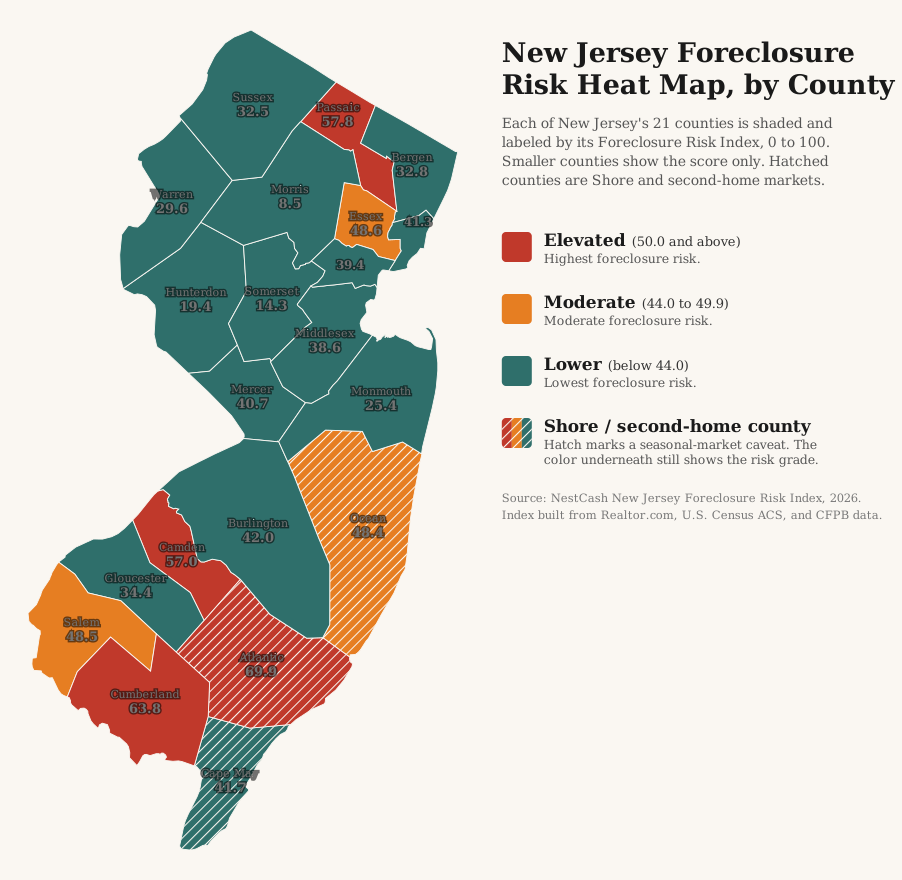
We built a county-level Foreclosure Risk Index from four public datasets to see where that pressure sits now. The answer is South Jersey. Atlantic County, home to Atlantic City, ranks first, and Cumberland County, home to Vineland and Bridgeton, ranks second. Both grade Elevated in every version of the index we tested, and Camden County joins them in all but one. In the north, Passaic County, home to Paterson, grades Elevated on the heaviest housing cost burden in the state. The affluent counties of the north-central belt, Morris, Somerset, and Hunterdon, are the safest ground in New Jersey.
ATTOM’s own county data points the same way. The four New Jersey counties with the worst foreclosure filing rates in August 2026 were Salem, Cumberland, Camden, and Gloucester, all of them in South Jersey.
We score each county from 0 to 100 by blending four public signals, each weighted by how directly it bears on a mortgaged homeowner: market softness (35 percent), mortgage cost burden (30 percent), 90-day mortgage delinquency (20 percent), and unemployment (15 percent). Each signal is min-max normalized within New Jersey, so the score ranks counties against one another in the state, not against a national or absolute standard. A county grades Elevated at 50 or above, Moderate from 44 to 49.9, and Lower below 44. Across this series we rank only counties with at least 12,000 housing units, so that a county with a few thousand homes never lands at the top of a statewide list on noise alone. All 21 New Jersey counties clear that bar, so every county is ranked. Because New Jersey’s results lean on two inputs that need care, the Shore’s seasonal housing and the way unemployment is measured, we tested the index five different ways and report which findings hold in all of them. The full weighting, the normalization, and the limits of the data are spelled out in the methodology section below.
Key findings
- New Jersey is a top-ten foreclosure state again. It ranked seventh by foreclosure rate in the first half of 2026, with 8,269 filings, one for every 459 housing units (ATTOM Data Solutions). The 21 percent rise from a year earlier matched the national increase, and filings were up only 2 percent from the first half of 2024.
- Cumberland and Atlantic counties are the findings that hold. Atlantic scores 69.9 and Cumberland 63.8, and both grade Elevated in all five versions of the index we tested, including versions that use current unemployment data and versions that drop days on market. Cumberland has the highest share of listings with a price cut in the state, 19.3 percent.
- The pressure is concentrated in South Jersey. Camden County (57.0) grades Elevated on the highest published mortgage delinquency rate in New Jersey, 1.8 percent, and Salem County (48.5) grades Moderate. ATTOM named Salem, Cumberland, Camden, and Gloucester as the New Jersey counties with the worst foreclosure filing rates in August 2026.
- North Jersey’s risk is about cost, not a weak market. Passaic County grades Elevated at 57.8 even though its homes sell quickly, because 40.8 percent of its mortgaged owners spend more than 30 percent of income on housing, the highest share in the state. Essex County, home to Newark, grades Moderate at 48.6, but that result is sensitive to how unemployment is measured.
- Atlantic City has been at or near the top of the national list for a decade. The Atlantic City metro had the highest foreclosure rate of any U.S. metro every year from 2014 through 2019, and it ranked fifth in 2025 (ATTOM Data Solutions).
Methodology
Two limits to read first
We state these before the method because they shape how the New Jersey results should be read.
The Shore counties. Median days on market is half of the market-softness input, and in the Jersey Shore counties it is inflated by seasonal inventory: beach houses and summer rentals that take longer to sell for reasons unrelated to household strain. To flag these counties by rule rather than judgment, we used the Census count of homes held for seasonal, recreational, or occasional use. Statewide, 3.4 percent of New Jersey’s homes fall in that category. Three counties are at 5 percent or more, the cutoff we use across this series: Cape May (49.9 percent), Ocean (13.5 percent), and Atlantic (12.8 percent). The next county below the line, Sussex, is at 4.4 percent. These three are hatched on the map and marked with a dagger in the chart and table, the same treatment we gave the lake counties in our Oklahoma index and the mountain resort counties in our Colorado index.
The flag matters less for Atlantic County than its slow market might suggest. Scored on price cuts alone, without days on market, Atlantic still scores 64.0 and grades Elevated. Cape May falls from 41.7 to 35.3, and Ocean barely moves, from 48.4 to 49.6.
How unemployment is measured. Like every state in this series, the index uses the Census Bureau’s five-year unemployment estimate, which averages 2020 through 2024. That window includes the 2020 pandemic shutdowns, which hit New Jersey’s casino, hospitality, and urban service economies especially hard. The current picture is different. Over the most recent 12 months of published data, from August 2025 through August 2026, the Bureau of Labor Statistics puts Atlantic County’s unemployment rate at 6.0 percent, against 8.8 percent in the five-year estimate, and Essex County’s at 5.8 percent, against 8.7. The Shore runs the other way: Cape May’s 12-month average is 8.2 percent, the highest in the state, because so many of its jobs disappear in winter.
We reran the index with the current BLS figures. Cumberland moves to first (68.5) and Atlantic to second (62.2), and both stay Elevated. Cape May rises into the Elevated tier on its winter unemployment, which we read as a seasonal effect, not household distress. Essex County drops from 48.6 to 40.6 and grades Lower. We kept the standard formula, because changing the method state by state would break the comparability that makes the series useful, but we treat Essex’s Moderate grade as provisional.
Data and sources
We built the index entirely from public and openly licensed data, and we cite each source at the point of use. Market conditions come from Realtor.com Economic Research (county listing data through September 2026). Housing tenure, mortgage status, cost burden, seasonal homes, county housing counts, and unemployment come from the U.S. Census Bureau’s American Community Survey five-year estimates (2020 to 2024). Mortgage delinquency comes from the Consumer Financial Protection Bureau’s Mortgage Performance Trends (latest data December 2025). Current county unemployment for the sensitivity test comes from the Bureau of Labor Statistics’ Local Area Unemployment Statistics. Statewide filing counts, national ranks, and trends come from ATTOM Data Solutions’ published foreclosure market reports. Every dataset we used is free and publicly available.
New Jersey’s delinquency data is unusually complete. The CFPB publishes a county’s 90-day delinquency rate only when the county has enough mortgages in its sample, and 18 of New Jersey’s 21 counties qualify. Only Cumberland, Salem, and Warren carry the statewide rate of 0.9 percent. Removing delinquency from the index raises Cumberland’s score rather than lowering it, so its rank does not rest on the substitute.
Building the index
The New Jersey Foreclosure Risk Index uses the same formula as every state in this series, a weighted blend of four signals, each chosen because it precedes or predicts foreclosure among homeowners who carry a mortgage:
35%
The share of active listings with a price cut and the median days a home sits on the market. A soft market matters because a homeowner in trouble who cannot sell quickly has fewer ways to avoid foreclosure. See the note on the Shore counties above.
30%
The share of owners with a mortgage who spend more than 30 percent of household income on housing. This is direct payment stress on the exact population that can be foreclosed on.
20%
The 90-day-or-more delinquency rate, the clearest early warning that foreclosures are coming. Published for 18 of New Jersey’s 21 counties.
15%
A secondary driver. We hold its weight down deliberately, because unemployment also captures renters and therefore dilutes a signal meant to describe homeowners. See the note on how it is measured above.
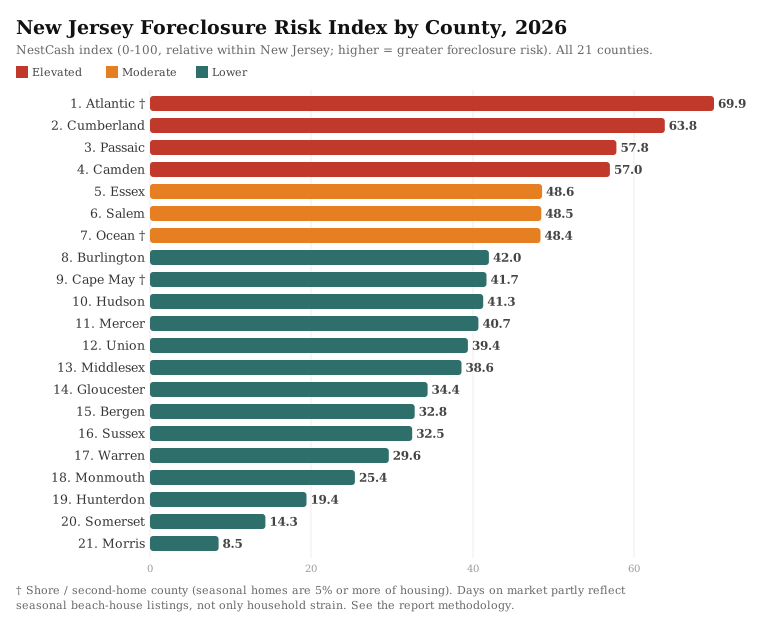
We normalized each signal across all 21 counties on a 0-to-1 scale, where 0 is the lowest value in the state and 1 is the highest, then applied the weights above and multiplied by 100. The result is a relative score: it ranks New Jersey counties against one another, not against a national or absolute standard. We then graded each county by its score, Elevated for 50.0 or above, Moderate for 44.0 to 49.9, and Lower for anything below 44.0. Four counties land in the Elevated tier, three in Moderate, and 14 in Lower. The four Elevated counties hold 15.5 percent of the state’s homes.
To test how much the results depend on any one input, we scored the counties five ways: the standard index; the standard index with current BLS unemployment in place of the five-year estimate; the index with delinquency removed and its weight spread proportionally across the other three signals; the index with market softness measured by price cuts alone; and price cuts alone combined with current BLS unemployment. When we call a finding robust in this report, it holds in all five.
Other limitations
The index is relative. A Lower grade means lower measured risk than other New Jersey counties, not low risk in absolute terms, and in a state with New Jersey’s foreclosure history that distinction matters. The index also measures leading pressure, not completed foreclosures or filings, so it will not match any single month’s filing counts. Several smaller counties had fewer than 400 active listings in September 2026 (Salem 228, Warren 272, Hunterdon 338, Cumberland 365), so their market-softness figures carry more noise than the larger counties’. Counties that tie at the published one-decimal score would share a rank. None do in this edition.
Findings
The index
Ranked from most to least risk on the standard formula. Read the daggered Shore counties with the limits above in mind.
South Jersey: the findings that hold
Cumberland County, in the far south of the state along the Delaware Bay, is the most consistent result in this report. It scores 63.8 and ranks second on the standard index, and it ranks first in three of the four alternative versions. It has the highest share of listings with a price cut in New Jersey, 19.3 percent, and its mortgaged owners carry a 36.8 percent cost burden, the third highest in the state. Its current unemployment rate, 7.5 percent over the latest 12 months, is the highest of any county outside the Shore. Cumberland’s market data is thinner than most, 365 active listings in September 2026, but its rank does not depend on any single input.
Atlantic County ranks first at 69.9. It has the slowest market in the state, a median of 63 days on market, which is partly the Shore effect we flag above. But its owners carry a 34.1 percent cost burden, and on price cuts alone, with days on market removed, it still scores 64.0 and grades Elevated. Atlantic’s distress also has the longest record: the Atlantic City metro had the highest foreclosure rate of any U.S. metro every year from 2014 through 2019, peaking at 3.43 percent of homes in 2015, and it still ranked fifth nationally in 2025, with one filing for every 192 housing units (ATTOM Data Solutions).
Camden County, across the Delaware River from Philadelphia, ranks fourth at 57.0. Its Elevated grade rests on the highest published delinquency rate in New Jersey, 1.8 percent, and on the second-highest share of price cuts, 17.4 percent. Without delinquency it scores 46.3 and grades Moderate, so of the four Elevated counties, Camden is the one most dependent on a single signal. Philadelphia itself tops our Pennsylvania index, at 76.8.
Salem County (48.5), the smallest county in the state with 27,732 homes, grades Moderate on a slow market, a median of 57 days, and a 7.4 percent unemployment estimate, the fourth highest in the state. Gloucester County grades Lower at 34.4 on the standard index, but it has the third-highest share of price cuts, 17.2 percent, and a published delinquency rate of 1.3 percent, and it rises to Moderate when market softness is measured by price cuts alone. ATTOM named Gloucester, along with Salem, Cumberland, and Camden, among the New Jersey counties with the worst foreclosure filing rates in August 2026.
North Jersey: a cost problem, not a market problem
The two highest-scoring counties in the north look nothing like South Jersey on market data. Homes in Passaic County sell in a median of 40 days, and only 9.0 percent of listings carry a price cut, one of the lowest shares in the state. Passaic grades Elevated at 57.8 anyway, because 40.8 percent of its mortgaged owners spend more than 30 percent of income on housing, the highest share in New Jersey and well above the statewide 32.2 percent. It stays Elevated in four of the five versions of the index.
Essex County, home to Newark, scores 48.6 and grades Moderate on a 36.5 percent cost burden and a high five-year unemployment estimate, 8.7 percent. That estimate is the weak point. With current BLS unemployment, 5.8 percent, Essex scores 40.6 and grades Lower, so we would not describe it as a foreclosure hotspot on this evidence. Hudson County, across the river from Manhattan, has the second-highest cost burden in the state, 38.6 percent, but it grades Lower at 41.3 because its delinquency rate, 0.5 percent, is tied for the lowest in New Jersey.
Mercer County, home to Trenton, ranks 11th at 40.7 and grades Lower. That is a long way from the late 2010s, when the Trenton metro had the second-highest foreclosure rate of any U.S. metro every year from 2015 through 2019 (ATTOM Data Solutions).
The Shore and the safest ground
Ocean County, the largest housing market on the Shore and the county with the most active listings in the state, 2,800 in September 2026, grades Moderate at 48.4. Cape May, where half of all homes are second homes, grades Lower at 41.7, with a delinquency rate of 0.5 percent tied for the lowest in the state. Monmouth County, at the northern end of the Shore, scores 25.4.
The safest ground in New Jersey is the affluent belt of the north-central and northwest counties, and it is the safest in every version of the index we ran. Morris County is the lowest-scoring county in the state at 8.5, with the fastest market in New Jersey, a median of 31 days on market, and a price-cut share of 8.0 percent, tied with Essex for the lowest. Somerset County (14.3) has the lowest cost burden in the state, 25.9 percent, and Hunterdon County (19.4) the lowest unemployment, 4.6 percent on the five-year estimate and 3.9 percent on current BLS data. Bergen County, the largest county in the state by housing, scores 32.8.
How today compares with the last crisis
New Jersey’s foreclosure crisis did not end when the nation’s did. In 2009, 63,208 New Jersey properties received a foreclosure filing, 1.81 percent of the state’s housing, against 2.21 percent nationally, which ranked New Jersey 14th among the states (RealtyTrac). By 2014 the national rate had fallen to 0.85 percent, but New Jersey’s was 1.87 percent, higher than in 2009. It reached 1.91 percent in 2015, the highest New Jersey rate we could verify, when the national rate was 0.82 percent, and New Jersey had the worst foreclosure rate in the country every year from 2015 through 2019.
The reason is the court process. Every New Jersey foreclosure must go through the courts, and the backlog from the crash took years to work through. ATTOM’s 2016 year-end report put New Jersey’s average time to complete a foreclosure at 1,383 days, close to four years. The state’s 2010 to 2013 rates were not published in the year-end reports we could verify, so the chart leaves those years blank rather than estimate them.
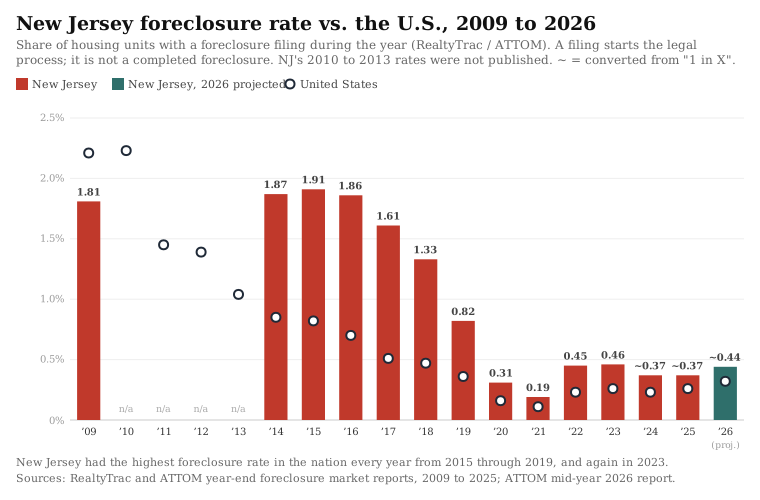
At its first-half pace, New Jersey is on track for a foreclosure rate of roughly 0.44 percent of homes in 2026, about a quarter of its 2015 level but still above the national pace. New Jersey’s rate has been above the national rate in every year from 2014 on. A filing marks the start of the legal process, not a completed foreclosure, and the 2026 figure doubles the first-half rate, so it is an approximation.
If you are a New Jersey homeowner facing foreclosure
This report is a market analysis, not legal advice, but the data points to a few things worth knowing. New Jersey is a judicial foreclosure state, so every foreclosure goes through the courts. Before a lender can file, it must send you a Notice of Intent to Foreclose, and you have 30 days from receiving it to pay what is owed or make other arrangements. Once you are served with a foreclosure complaint, you have 35 days to file an answer (New Jersey Courts).
New Jersey runs a free court foreclosure mediation program, in which a neutral mediator works with you and your lender toward an outcome both can accept. You can request mediation up to 60 days after you are served with the complaint, and the court may accept a late request (Legal Services of New Jersey). If the case reaches a sheriff’s sale, you can request two adjournments of the sale date, each for up to 30 days, and after the sale you have 10 days to redeem the property by paying what is owed.
Free help is available. A HUD-approved housing counselor can review your options at no cost, and you can find one through the CFPB’s housing counselor search. Legal Services of New Jersey offers free legal help to eligible homeowners through its statewide hotline, 1-888-576-5529. The New Jersey Courts also warn about foreclosure rescue and loan-modification scams, so be wary of any company that asks for money up front to save your home.
The full data
All 21 counties, from highest to lowest Foreclosure Risk Index. An asterisk on the delinquency rate marks a county where the New Jersey statewide rate was substituted because the county’s own rate is not separately reported. A dagger marks a Shore or second-home county, where seasonal homes are 5 percent or more of housing and days on market partly reflect seasonal listings. Unemployment is the five-year Census estimate used in the index. See the limits at the start of the methodology.
| Rank | County | FRI | Grade | Price cuts | Median DOM | Cost burden | 90+ delinq | Unemployment |
|---|---|---|---|---|---|---|---|---|
| 1 | Atlantic † | 69.9 | Elevated | 15.5% | 63 | 34.1% | 1.1% | 8.8% |
| 2 | Cumberland | 63.8 | Elevated | 19.3% | 50 | 36.8% | 0.9*% | 6.8% |
| 3 | Passaic | 57.8 | Elevated | 9.0% | 40 | 40.8% | 1.1% | 8.0% |
| 4 | Camden | 57.0 | Elevated | 17.4% | 46 | 28.9% | 1.8% | 6.9% |
| 5 | Essex | 48.6 | Moderate | 8.0% | 40 | 36.5% | 1.0% | 8.7% |
| 6 | Salem | 48.5 | Moderate | 16.2% | 57 | 28.6% | 0.9*% | 7.4% |
| 7 | Ocean † | 48.4 | Moderate | 16.2% | 52 | 34.2% | 0.8% | 5.4% |
| 8 | Burlington | 42.0 | Lower | 16.9% | 41 | 28.3% | 1.5% | 5.3% |
| 9 | Cape May † | 41.7 | Lower | 13.7% | 59 | 33.4% | 0.5% | 5.3% |
| 10 | Hudson | 41.3 | Lower | 9.6% | 46 | 38.6% | 0.5% | 6.0% |
| 11 | Mercer | 40.7 | Lower | 16.1% | 52 | 28.1% | 0.9% | 6.3% |
| 12 | Union | 39.4 | Lower | 8.8% | 38 | 35.0% | 1.1% | 6.5% |
| 13 | Middlesex | 38.6 | Lower | 12.2% | 46 | 32.5% | 0.7% | 6.7% |
| 14 | Gloucester | 34.4 | Lower | 17.2% | 37 | 26.9% | 1.3% | 5.3% |
| 15 | Bergen | 32.8 | Lower | 10.4% | 39 | 34.5% | 0.7% | 5.8% |
| 16 | Sussex | 32.5 | Lower | 11.7% | 41 | 29.5% | 1.3% | 5.1% |
| 17 | Warren | 29.6 | Lower | 12.6% | 40 | 30.7% | 0.9*% | 5.1% |
| 18 | Monmouth | 25.4 | Lower | 12.0% | 45 | 30.2% | 0.5% | 5.4% |
| 19 | Hunterdon | 19.4 | Lower | 8.9% | 48 | 28.7% | 0.7% | 4.6% |
| 20 | Somerset | 14.3 | Lower | 13.2% | 39 | 25.9% | 0.6% | 4.7% |
| 21 | Morris | 8.5 | Lower | 8.0% | 31 | 28.3% | 0.6% | 5.2% |
What we will watch
We plan to update this index quarterly, beginning with the first quarter of 2027. Three things will tell us where New Jersey goes from here: whether Camden County’s delinquency rate, already the highest in the state, keeps rising, which would make its Elevated grade less dependent on one signal; whether the gap between the five-year and current unemployment figures in Essex and Atlantic closes as the 2020 shutdown years roll out of the Census window; and whether South Jersey’s share of the state’s foreclosure filings keeps growing, as ATTOM’s August county ranking suggests.
Sources and data
- Foreclosure activity and trend. ATTOM Data Solutions, 2026 Mid-Year U.S. Foreclosure Market Report and U.S. Foreclosure Rates by State, August 2026 (published September 18, 2026). Used for statewide filing counts, national ranks, the year-over-year change, and the counties with the worst August filing rates.
- Housing market softness. Realtor.com Economic Research, county inventory core metrics through September 2026. Used for the price-cut share, median days on market, and active listing counts.
- Housing, mortgage status, cost burden, seasonal homes, and unemployment. U.S. Census Bureau, American Community Survey five-year estimates, 2020 to 2024. Used for county housing counts, the mortgaged-owner universe, housing cost burden, the seasonal-home share behind the Shore flag, and the unemployment rate in the index.
- Current unemployment. U.S. Bureau of Labor Statistics, Local Area Unemployment Statistics, county unemployment rates, the 12 published months from August 2025 through August 2026 (BLS published no October 2025 figures). Used only for the sensitivity test, not in the standard index.
- Mortgage delinquency. CFPB Mortgage Performance Trends, data through December 2025. Used for the 90-or-more day delinquency rates.
- Historical foreclosure rates. RealtyTrac, 2009 Year-End Foreclosure Market Report (via the Financial Crisis Inquiry Commission archive), and the RealtyTrac and ATTOM year-end U.S. foreclosure market reports for 2010 through 2025, including ATTOM’s 2016, 2018, and 2025 reports. Used for New Jersey’s annual foreclosure rates and ranks, the Atlantic City and Trenton metro rankings, and average foreclosure timelines. The 2024 and 2025 rates are converted from ATTOM’s published “one in every X housing units” figures, and 2026 is a full-year projection from the first-half rate.
- Foreclosure process. New Jersey Courts, Foreclosure Self-Help and Legal Services of New Jersey. Used for the notice, answer, mediation, adjournment, and redemption rules.
About NestCash
NestCash buys houses for cash in twelve states and publishes original housing and distressed-property research across U.S. markets. Our original housing research helps homeowners, buyers, and investors understand local market conditions. This report may be cited and its charts embedded with attribution to NestCash.

John is the Founder of NestCash and a leading voice in real estate investing and housing market strategy. With experience across 12 states, he helps buyers, sellers, and investors make smarter decisions using real-world insight and market data.