

The 2026 Oklahoma Foreclosure Risk Index
Where financial pressure on Oklahoma homeowners is building, county by county
 Published on September 28th, 2026, by John Carter | Founder, NestCash
Original NestCash research, free to read and cite.

Abstract
Oklahoma sits in the middle of the national foreclosure table. In the first half of 2026 the state recorded 2,509 foreclosure filings, one for every 708 housing units, the 20th-highest rate in the country. Filings were up 14 percent from the first half of 2025, below the national increase of 21 percent (ATTOM Data Solutions).
We built a county-level Foreclosure Risk Index from four public datasets to see where the pressure sits inside the state. The answer is that housing stress in Oklahoma takes two different forms. The metro counties around Oklahoma City and Tulsa are seeing heavier price cutting than most of the state. The lake and rural counties have slower markets and heavier owner cost burdens. Our standard index weighs the second pattern more heavily, and we show exactly how much that matters.
One result holds up in every version of the index we tested: Delaware County, on Grand Lake in the northeast corner of the state, ranks at or near the top. Its owners carry the second-highest housing cost burden in Oklahoma, and its price-cut share is above the state median.
This report explains how the index is built, publishes every county score, and states its limits up front, because in Oklahoma two of them change how the results should be read.
We score each county from 0 to 100 by blending four public signals, each weighted by how directly it bears on a mortgaged homeowner: market softness (35 percent), mortgage cost burden (30 percent), 90-day mortgage delinquency (20 percent), and unemployment (15 percent). Each signal is min-max normalized within Oklahoma, so the score ranks counties against one another in the state, not against a national or absolute standard. A county grades Elevated at 50 or above, Moderate from 44 to 49.9, and Lower below 44. One rule keeps the ranking honest: we rank the 35 counties with at least 12,000 housing units. Oklahoma has 77 counties, and the other 42 have too few homes for sale to score a market reliably, so they stay in the data but are not ranked. The 35 ranked counties hold 87.6 percent of the state’s homes. Because some of Oklahoma’s results lean on inputs that need care, we tested the index several ways, including versions without days on market and without delinquency, and report which findings hold up. The full weighting, the normalization, and the limits of the data are spelled out in the methodology section below.
Key findings
- Oklahoma is a mid-table state. It ranked 20th by foreclosure rate in the first half of 2026, 25th in the first quarter, and 25th again in August, one filing for every 4,721 housing units that month (ATTOM Data Solutions). Filings are up 45 percent from the first half of 2024, but from a modest base.
- Delaware County is the most consistent finding. It scores 64.7 and ranks first on the standard index, and it stays in the top three in every sensitivity test we ran, including versions that remove days on market and delinquency. Its owners carry a 29.5 percent housing cost burden, second only to Payne County.
- Housing stress looks different in the metros and the countryside. Oklahoma, Tulsa, Cleveland, and Canadian counties all post price-cut shares above the 19.3 percent median across ranked counties. The lake and rural counties have the slowest markets, with homes in McCurtain and Delaware counties sitting a median of 123 and 100 days.
- The metro rankings are sensitive, and we say so. Oklahoma City and Tulsa grade Lower on the standard index, but both rise into the top ten when the two weakest inputs are removed. We do not read the standard result as evidence that the major metros are insulated from housing stress.
- Tulsa’s foreclosure pipeline is slowing. In July 2026 the Tulsa metro posted the largest year-over-year drop in foreclosure starts of any U.S. metro with at least 200,000 residents, from 138 to 41 (ATTOM Data Solutions).
Methodology
Two limits to read first
We state these before the method because they shape how the Oklahoma results should be read.
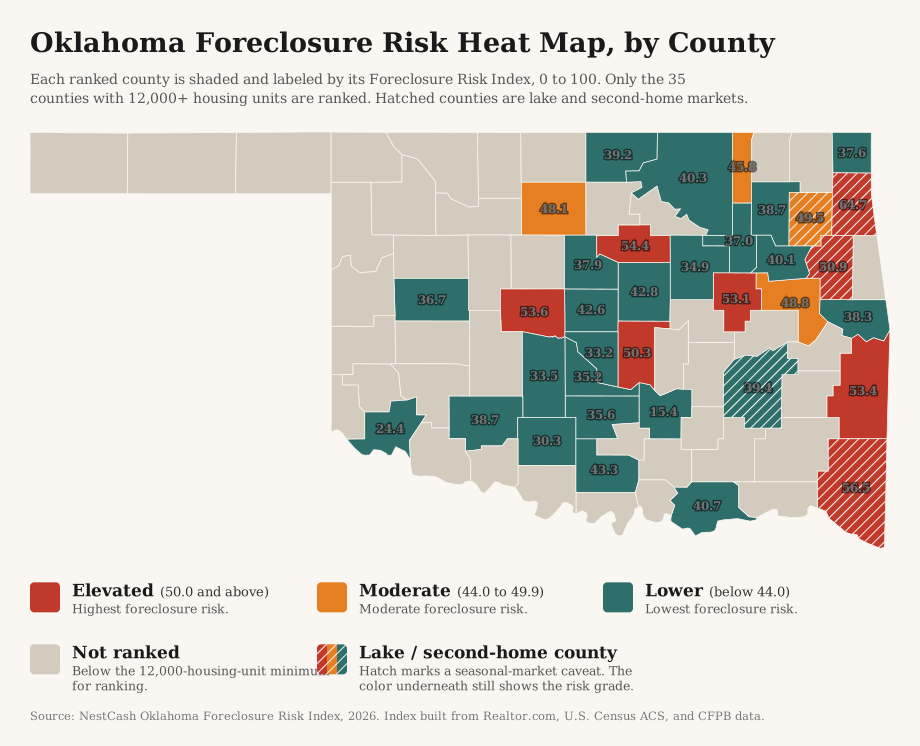
Lake and second-home counties. Median days on market is half of the market-softness input, and in Oklahoma’s lake counties it is inflated by seasonal inventory: cabins, lake houses, and short-term rentals that take longer to sell for reasons unrelated to household strain. To flag these counties by rule rather than judgment, we used the Census count of homes held for seasonal, recreational, or occasional use. Statewide, 1.7 percent of Oklahoma’s homes fall in that category. Five ranked counties are at 5 percent or more, roughly three times the state share: Delaware (20.4 percent, Grand Lake), McCurtain (6.4 percent, Broken Bow), Mayes (6.0 percent, Grand Lake), Pittsburg (6.0 percent, Lake Eufaula), and Cherokee (5.9 percent, Lake Tenkiller). The next county below the line is at 4.2 percent. These five are hatched on the map and marked with a dagger in the chart and table. We apply the same treatment we used for the mountain resort counties in our Colorado index.
The flag matters more for some counties than others. Scored on price cuts alone, Delaware County still scores 62.8. McCurtain County falls from 56.5 to 43.6, which would grade Lower, so its second-place rank rests largely on the slow market around Broken Bow.
Delinquency data for only four counties. The CFPB publishes a county’s 90-day delinquency rate only when the county has enough mortgages in its sample, and in Oklahoma only four ranked counties qualify, all of them metro counties: Canadian (1.5 percent), Oklahoma (1.1 percent), Tulsa (0.9 percent), and Cleveland (0.9 percent). The other 31 ranked counties carry the statewide rate of 1.2 percent. That creates an imbalance: three of the four metro counties have real rates below the statewide figure, while every rural county is assigned the higher statewide number.
What the two limits do to the metros. Oklahoma City and Tulsa grade Lower under the standard index, but both rise materially when the delinquency estimate and days-on-market input are removed. With delinquency removed, Tulsa County moves from 26th to 11th and Oklahoma County from 15th to 12th, and both grade Moderate. With delinquency removed and market softness measured by price cuts alone, Tulsa ranks seventh, Oklahoma County eighth, and Cleveland County ninth. Because those two inputs materially affect the metro rankings, this report does not interpret the standard-index result as evidence that the major metros are insulated from housing stress. Canadian County moves the other way: its fourth-place Elevated rank depends on its 1.5 percent delinquency rate, the highest published in the state, and without delinquency it scores 42.0 and grades Lower.
We kept the standard formula anyway. Changing the method state by state would break the comparability that makes the series useful, and disclosing where the result is fragile is more useful to readers than tuning it away.
Data and sources
We built the index entirely from public and openly licensed data, and we cite each source at the point of use. Market conditions come from Realtor.com Economic Research (county listing data through August 2026). Housing tenure, mortgage status, cost burden, seasonal homes, county housing counts, and unemployment come from the U.S. Census Bureau’s American Community Survey five-year estimates (2020 to 2024). Mortgage delinquency comes from the Consumer Financial Protection Bureau’s Mortgage Performance Trends (latest data December 2025). Statewide filing counts, national ranks, and trends come from ATTOM Data Solutions’ published foreclosure market reports. Every dataset we used is free and publicly available.
Building the index
The Oklahoma Foreclosure Risk Index uses the same formula as every state in this series, a weighted blend of four signals, each chosen because it precedes or predicts foreclosure among homeowners who carry a mortgage:
35%
The share of active listings with a price cut and the median days a home sits on the market. A soft market matters because a homeowner in trouble who cannot sell quickly has fewer ways to avoid foreclosure. See the note on lake counties above.
30%
The share of owners with a mortgage who spend more than 30 percent of household income on housing. This is direct payment stress on the exact population that can be foreclosed on.
20%
The 90-day-or-more delinquency rate, the clearest early warning that foreclosures are coming. See the note on Oklahoma’s delinquency data above.
15%
A secondary driver. We hold its weight down deliberately, because unemployment also captures renters and therefore dilutes a signal meant to describe homeowners.
We normalized each signal across the ranking-eligible counties on a 0-to-1 scale, where 0 is the lowest value in that set and 1 is the highest, then applied the weights above and multiplied by 100. The result is a relative score: it ranks Oklahoma counties against one another, not against a national or absolute standard. We then graded each county by its score, Elevated for 50.0 or above, Moderate for 44.0 to 49.9, and Lower for anything below 44.0. Eight counties land in the Elevated tier, four in Moderate, and 23 in Lower.
Oklahoma has 77 counties. We limited the ranking to counties with at least 12,000 housing units, the same floor we use across this series, because price-cut shares and days-on-market figures drawn from a small number of listings are too noisy to rank. That leaves 35 ranked counties, which together hold 87.6 percent of the state’s housing. The other 42 are shown in gray on the map and listed below the table, with no score or rank. Counties that tie at the published one-decimal score share a rank.
Other limitations
The index is relative. A Lower grade means lower measured risk than other Oklahoma counties, not low risk in absolute terms. It also measures leading pressure, not completed foreclosures or filings, so it will not match any single month’s filing counts. ATTOM’s August 2026 state ranking named Caddo, Greer, Harmon, and Kingfisher as the Oklahoma counties with the worst foreclosure rates that month. All four fall below our 12,000-home ranking floor, so the index offers no direct check on them. Several smaller ranked counties had fewer than 110 active listings in August 2026 (Custer and Jackson 86 each, Osage 94, Pontotoc 106, Okmulgee 108), so their market-softness figures carry more noise than the metros’.
Findings
The index
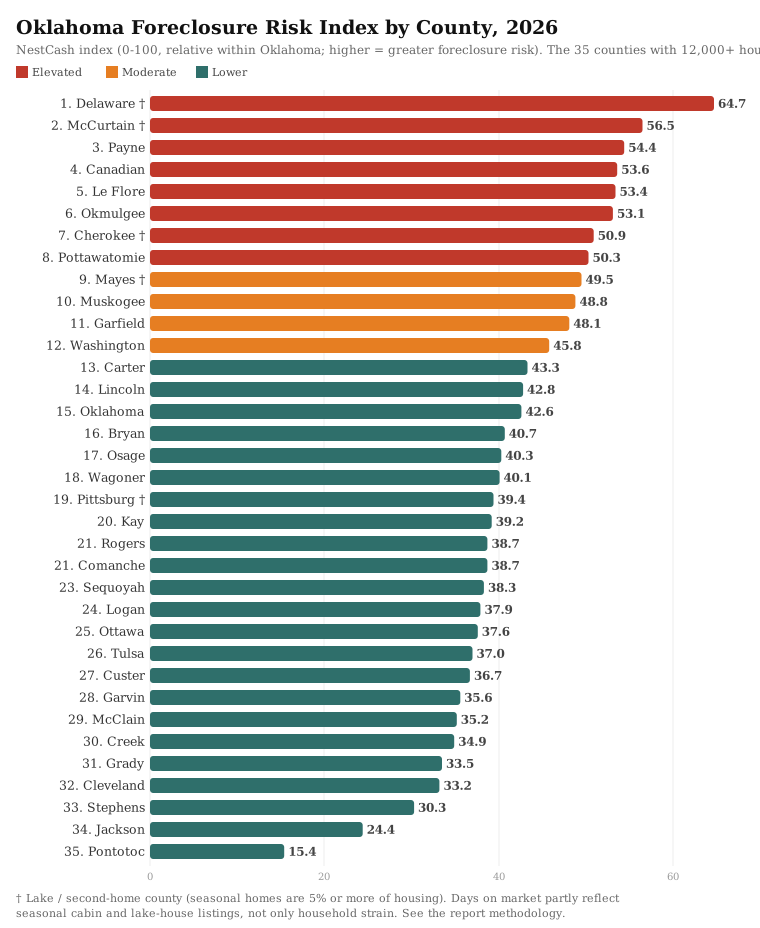
Ranked from most to least risk on the standard formula. Read the daggered lake counties and the metro rankings with the limits above in mind.
Delaware County: the finding that holds
Delaware County, in the northeast corner of the state along Grand Lake, scores 64.7 and ranks first. It is also the most seasonal housing market in Oklahoma: 20.4 percent of its homes are held for seasonal or recreational use, and the typical listing sat 100 days in August 2026. That is why we flag it.
But Delaware’s rank does not depend on the slow market. Its mortgaged owners carry a 29.5 percent housing cost burden, second only to Payne County and well above the statewide 24.3 percent. Its 21.8 percent price-cut share is above the state median, and its unemployment rate is 5.2 percent. Scored on price cuts alone it still reaches 62.8, and it stays in the top three in every version of the index we ran. Some of its cost burden may reflect second-home owners whose housing costs are high relative to reported local income, the pattern we found in Colorado’s resort counties. Even so, of all the county results in this report, Delaware’s is the one we are most confident in.
Eastern Oklahoma
Several of the counties behind Delaware sit in the eastern third of the state, and their scores rest on more than market speed. Okmulgee County (53.1) has the highest unemployment rate of any ranked county, 7.3 percent, and it stays near the top when days on market and delinquency are removed. Le Flore County (53.4), on the Arkansas line, carries the third-highest cost burden in the state at 27.5 percent. Cherokee County (50.9), home to Tahlequah and Lake Tenkiller, grades Elevated and is one of the flagged lake counties. Muskogee County (48.8) and Mayes County (49.5) grade Moderate.
McCurtain County, in the far southeast, ranks second at 56.5. It has the slowest market in the state, a median of 123 days on market, around the Broken Bow and Hochatown cabin market. On price cuts alone it falls to 43.6. We report the score the formula produces but would not read McCurtain’s rank as evidence of household distress on the scale of Delaware or Okmulgee.
The metros: more price cuts, lower scores
Oklahoma County and Tulsa County together hold 37.1 percent of the state’s homes, and on the standard index they rank 15th (42.6) and 26th (37.0). Cleveland County, home to Norman, ranks 32nd (33.2). All three grade Lower.
That is not because their markets are strong. Oklahoma County had 23.5 percent of its listings cut in August 2026, Tulsa County 23.1 percent, and Cleveland County 25.0 percent, all well above the 19.3 percent median across ranked counties. Their owners carry cost burdens close to the statewide figure. What holds their scores down is speed and delinquency. Metro homes sell faster than rural and lake homes, a median of 50 to 55 days against 64 for ranked counties overall, and Tulsa and Cleveland have published delinquency rates of 0.9 percent, below the 1.2 percent assigned to rural counties. When those two inputs are removed, all three metro counties rise into the top ten.
The filing data points in the metros’ favor for now. In July 2026 the Tulsa metro had the largest year-over-year decline in foreclosure starts of any large U.S. metro, from 138 to 41 (ATTOM Data Solutions). A falling pipeline alongside heavy price cutting is worth watching, and it is the main reason we treat the metro grades as provisional.
Canadian County, west of Oklahoma City and home to Yukon, Mustang, and El Reno, is the metro exception. It ranks fourth at 53.6, with a 24.0 percent price-cut share and the highest published delinquency rate in the state, 1.5 percent. Its Elevated grade depends on that delinquency rate.
Pottawatomie County (50.3), home to Shawnee east of Oklahoma City, has the highest price-cut share of any ranked county, 28.5 percent, and ranks first of all when the index is built on price cuts without delinquency.
College towns and the southwest
Payne County, home to Stillwater and Oklahoma State University, ranks third at 54.4 on the highest cost burden in the state, 32.4 percent. College towns tend to show high measured cost burdens because of household income patterns around a university, and its price-cut share, 14.0 percent, is among the lowest of any ranked county. We would not read Payne’s rank as the same kind of strain seen in Okmulgee or Delaware.
Comanche County, home to Lawton and Fort Sill, has the second-highest unemployment rate among ranked counties, 7.1 percent, but grades Lower at 38.7 on a low price-cut share and a moderate cost burden. Pontotoc County, home to Ada, is the lowest-scoring county in the index at 15.4, with the lowest cost burden (16.7 percent) and the smallest share of price cuts (12.1 percent).
How today compares with the last crisis
Oklahoma largely sidestepped the 2007 to 2011 foreclosure crisis. In 2009, 12,937 Oklahoma properties received a foreclosure filing, one for every 125 housing units, or 0.80 percent of the state’s housing, against 2.21 percent nationally. That ranked Oklahoma 34th among the states, according to RealtyTrac’s year-end report. Using the changes RealtyTrac published for 2009, Oklahoma recorded roughly 12,500 filings in 2008 and roughly 8,300 in 2007. We could not find Oklahoma’s 2010 and 2011 totals in a source we could verify, so the chart shows the three crisis years we could confirm.
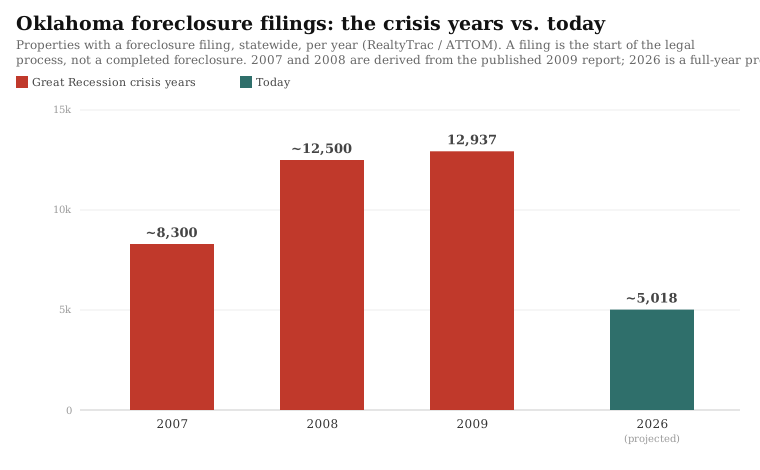
At the first-half pace of 2,509 filings, Oklahoma is on track for roughly 5,000 in 2026, about 39 percent of its 2009 total. That is a smaller gap than in the states at the center of the crisis, but mainly because Oklahoma’s crisis-era numbers were modest to begin with. A filing marks the start of the legal process, not a completed foreclosure, and RealtyTrac’s 2009 data covered fewer counties than ATTOM’s data does today, so the comparison is approximate.
If you are an Oklahoma homeowner facing foreclosure
This report is a market analysis, not legal advice, but the data points to a few things worth knowing. Most Oklahoma foreclosures go through the courts. The lender files a foreclosure case and serves you with the petition, and you have 20 days after service to file an answer. Legal Aid Services of Oklahoma recommends contacting an attorney for help with that answer (Legal Aid Services of Oklahoma).
Some Oklahoma mortgages allow a lender to sell the property without going to court, under a power of sale. If the property is your homestead, Oklahoma law lets you require a court foreclosure instead. You must send the lender written notice by certified mail, at least 10 days before the scheduled sale, stating that the property is your homestead and that you elect judicial foreclosure, and file a copy with the county clerk (Title 46, Section 43).
In a court foreclosure you keep the right to redeem the home, by paying the full amount due plus costs, until the court confirms the sheriff’s sale. Free help is available. A HUD-approved housing counselor can review your options at no cost, and you can find one through the CFPB’s housing counselor search. Legal Aid Services of Oklahoma offers free legal information and help for eligible homeowners. Acting early matters, since the answer deadline is short and a foreclosure can stay on a credit report for up to seven years.
The full data
All 35 ranked counties, from highest to lowest Foreclosure Risk Index. Counties that tie at the published score share a rank. An asterisk on the delinquency rate marks a county where the Oklahoma statewide rate was substituted because the county’s own rate is not separately reported. A dagger marks a lake or second-home county, where seasonal homes are 5 percent or more of housing and days on market partly reflect seasonal listings. See the limits at the start of the methodology.
| Rank | County | FRI | Grade | Price cuts | Median DOM | Cost burden | 90+ delinq | Unemployment |
|---|---|---|---|---|---|---|---|---|
| 1 | Delaware † | 64.7 | Elevated | 21.8% | 100 | 29.5% | 1.2*% | 5.2% |
| 2 | McCurtain † | 56.5 | Elevated | 16.4% | 123 | 26.2% | 1.2*% | 4.8% |
| 3 | Payne | 54.4 | Elevated | 14.0% | 60 | 32.4% | 1.2*% | 5.7% |
| 4 | Canadian | 53.6 | Elevated | 24.0% | 52 | 24.3% | 1.5% | 4.5% |
| 5 | Le Flore | 53.4 | Elevated | 20.2% | 75 | 27.5% | 1.2*% | 5.2% |
| 6 | Okmulgee | 53.1 | Elevated | 23.8% | 59 | 23.4% | 1.2*% | 7.3% |
| 7 | Cherokee † | 50.9 | Elevated | 21.5% | 81 | 24.9% | 1.2*% | 5.1% |
| 8 | Pottawatomie | 50.3 | Elevated | 28.5% | 59 | 23.0% | 1.2*% | 5.3% |
| 9 | Mayes † | 49.5 | Moderate | 19.8% | 64 | 25.0% | 1.2*% | 6.3% |
| 10 | Muskogee | 48.8 | Moderate | 22.8% | 53 | 25.4% | 1.2*% | 5.7% |
| 11 | Garfield | 48.1 | Moderate | 26.2% | 67 | 22.9% | 1.2*% | 4.9% |
| 12 | Washington | 45.8 | Moderate | 25.2% | 51 | 25.1% | 1.2*% | 4.4% |
| 13 | Carter | 43.3 | Lower | 19.3% | 87 | 23.8% | 1.2*% | 3.8% |
| 14 | Lincoln | 42.8 | Lower | 19.6% | 68 | 25.5% | 1.2*% | 3.9% |
| 15 | Oklahoma | 42.6 | Lower | 23.5% | 55 | 24.9% | 1.1% | 4.8% |
| 16 | Bryan | 40.7 | Lower | 16.0% | 66 | 25.4% | 1.2*% | 4.6% |
| 17 | Osage | 40.3 | Lower | 14.3% | 54 | 26.3% | 1.2*% | 5.3% |
| 18 | Wagoner | 40.1 | Lower | 23.7% | 61 | 22.1% | 1.2*% | 4.2% |
| 19 | Pittsburg † | 39.4 | Lower | 15.9% | 87 | 20.2% | 1.2*% | 5.7% |
| 20 | Kay | 39.2 | Lower | 12.6% | 67 | 24.2% | 1.2*% | 5.8% |
| 21 | Rogers | 38.7 | Lower | 20.8% | 65 | 21.6% | 1.2*% | 4.7% |
| 21 | Comanche | 38.7 | Lower | 14.7% | 61 | 21.1% | 1.2*% | 7.1% |
| 23 | Sequoyah | 38.3 | Lower | 17.3% | 76 | 22.0% | 1.2*% | 4.7% |
| 24 | Logan | 37.9 | Lower | 21.2% | 58 | 23.8% | 1.2*% | 3.6% |
| 25 | Ottawa | 37.6 | Lower | 16.0% | 71 | 26.1% | 1.2*% | 3.0% |
| 26 | Tulsa | 37.0 | Lower | 23.1% | 53 | 24.8% | 0.9% | 5.4% |
| 27 | Custer | 36.7 | Lower | 16.4% | 84 | 21.6% | 1.2*% | 4.2% |
| 28 | Garvin | 35.6 | Lower | 19.2% | 67 | 23.0% | 1.2*% | 3.4% |
| 29 | McClain | 35.2 | Lower | 16.8% | 64 | 22.1% | 1.2*% | 4.7% |
| 30 | Creek | 34.9 | Lower | 16.2% | 56 | 25.8% | 1.2*% | 3.3% |
| 31 | Grady | 33.5 | Lower | 14.7% | 61 | 21.3% | 1.2*% | 5.5% |
| 32 | Cleveland | 33.2 | Lower | 25.0% | 50 | 23.2% | 0.9% | 4.8% |
| 33 | Stephens | 30.3 | Lower | 12.3% | 66 | 20.9% | 1.2*% | 5.2% |
| 34 | Jackson | 24.4 | Lower | 15.7% | 47 | 17.5% | 1.2*% | 5.6% |
| 35 | Pontotoc | 15.4 | Lower | 12.1% | 60 | 16.7% | 1.2*% | 3.7% |
Forty-two counties are not ranked because they fall below the 12,000-housing-unit floor: Adair, Alfalfa, Atoka, Beaver, Beckham, Blaine, Caddo, Choctaw, Cimarron, Coal, Cotton, Craig, Dewey, Ellis, Grant, Greer, Harmon, Harper, Haskell, Hughes, Jefferson, Johnston, Kingfisher, Kiowa, Latimer, Love, Major, Marshall, McIntosh, Murray, Noble, Nowata, Okfuskee, Pawnee, Pushmataha, Roger Mills, Seminole, Texas, Tillman, Washita, Woods, and Woodward.
What we will watch
We plan to update this index quarterly, beginning with the first quarter of 2027. Three things will tell us where Oklahoma goes from here: whether heavy price cutting in Oklahoma, Tulsa, and Cleveland counties begins to show up as rising delinquency, which would move the metros up the standard index; whether Tulsa’s sharp drop in foreclosure starts holds; and whether the CFPB begins publishing delinquency rates for more Oklahoma counties, which would let us replace the statewide substitute in rural Oklahoma.
Sources and data
- Foreclosure activity and trend. ATTOM Data Solutions, 2026 Mid-Year U.S. Foreclosure Market Report, Q1 2026 U.S. Foreclosure Market Report, July 2026 U.S. Foreclosure Market Report, and U.S. Foreclosure Rates by State, August 2026 (published September 18, 2026). Used for statewide filing counts, national ranks, the year-over-year change, Tulsa metro foreclosure starts, and the counties with the worst August filing rates.
- Housing market softness. Realtor.com Economic Research, county inventory core metrics through August 2026. Used for the price-cut share, median days on market, and active listing counts.
- Housing, mortgage status, cost burden, seasonal homes, and unemployment. U.S. Census Bureau, American Community Survey five-year estimates, 2020 to 2024. Used for county housing counts, the mortgaged-owner universe, housing cost burden, the seasonal-home share behind the lake-county flag, and the unemployment rate.
- Mortgage delinquency. CFPB Mortgage Performance Trends, data through December 2025. Used for the 90-or-more day delinquency rates.
- Historical foreclosure rates. RealtyTrac, 2009 Year-End Foreclosure Market Report (via the Financial Crisis Inquiry Commission archive). Used for Oklahoma’s 2009 filing count and national rank. The 2007 and 2008 figures in the history chart are derived from the report’s published changes from those years, and 2026 is a full-year projection from first-half filings.
- Foreclosure process. Oklahoma Statutes Title 46, Section 43 and Legal Aid Services of Oklahoma. Used for the homestead election, answer deadline, and redemption rules.
About NestCash
NestCash buys houses for cash in twelve states and publishes original housing and distressed-property research across U.S. markets. Our original housing research helps homeowners, buyers, and investors understand local market conditions. This report may be cited and its charts embedded with attribution to NestCash.

John is the Founder of NestCash and a leading voice in real estate investing and housing market strategy. With experience across 12 states, he helps buyers, sellers, and investors make smarter decisions using real-world insight and market data.