
The 2026 Iowa Foreclosure
Risk Index
Polk County leads as Iowa catches up to the national rate
 Published on October 22nd, 2026, by John Carter | Founder, NestCash
Original NestCash research, free to read and cite.

Abstract
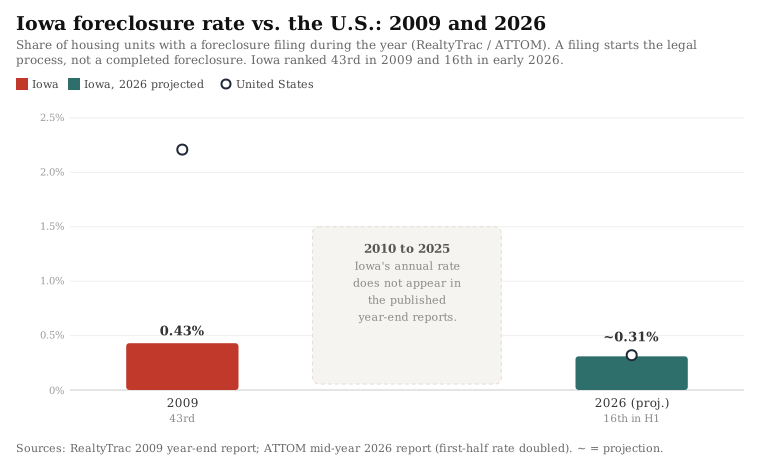
Iowa was not a crisis state. In 2009, 0.43 percent of its housing units had a foreclosure filing, the 43rd-highest rate of any state, against 2.21 percent nationally (RealtyTrac). Today its rate sits close to the national one. In the first half of 2026, 2,200 Iowa properties had a foreclosure filing, one for every 653 housing units, the 16th-highest rate of any state, against a national rate of one in 632. Filings were 5 percent higher than in the first half of 2025, while filings nationally rose 21 percent, and 37 percent higher than in the first half of 2024, while filings nationally rose 28 percent (ATTOM Data Solutions). In the third quarter of 2026, 7.8 percent of Iowa properties in the foreclosure process were vacant zombie foreclosures, the second-highest share of any state and more than double the national 3.3 percent. At the end of 2025, 0.9 percent of Iowa mortgages were 90 or more days delinquent, the same as the national rate (Consumer Financial Protection Bureau).
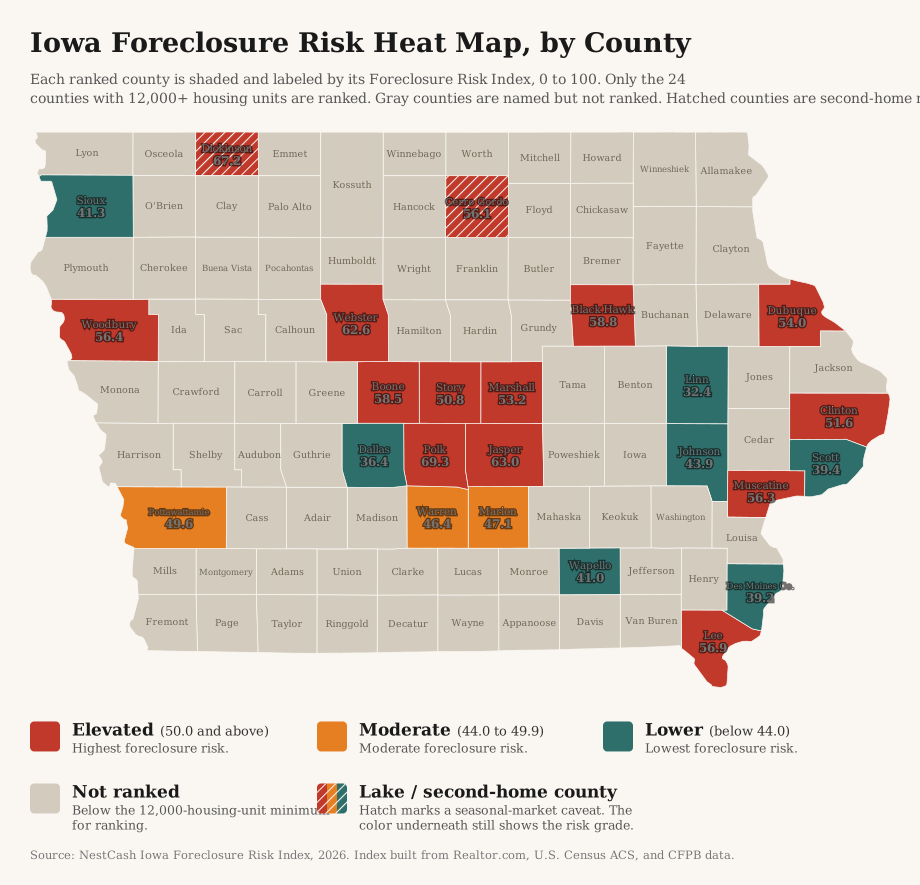
We built a county-level Foreclosure Risk Index from four public datasets to see where the pressure is building. Polk County, home to Des Moines and the state’s largest county by number of homes, ranks first at 69.3, and it ranks in the top two in every version of the index we tested. Dickinson County, home to Spirit Lake and Okoboji and a second-home market we flag throughout the report, ranks second at 67.2. Linn County, home to Cedar Rapids, ranks last of the 24 ranked counties at 32.4, and Dallas County, home to Waukee and Adel, ranks 23rd.
We score each county from 0 to 100 by blending four public signals, each weighted by how directly it bears on a mortgaged homeowner: market softness (35 percent), mortgage cost burden (30 percent), 90-day mortgage delinquency (20 percent), and unemployment (15 percent). Each signal is min-max normalized within Iowa, so the score ranks counties against one another in the state, not against a national or absolute standard. A county grades Elevated at 50 or above, Moderate from 44 to 49.9, and Lower below 44. We rank counties with at least 12,000 housing units, and 24 of Iowa’s 99 counties clear that floor, holding 68.2 percent of the state’s homes. Two ranked counties are second-home markets, and we flag them. We tested the index five different ways and report which findings hold in all of them. The full weighting, the normalization, and the limits of the data are spelled out in the methodology section below.
Key findings
- Iowa’s foreclosure rate has nearly caught up with the nation’s. It ranked 43rd in 2009, at about a fifth of the national rate, and 16th in the first half of 2026, at a rate close to the national one. Over two years, its filings rose faster than the nation’s, 37 percent against 28 percent (ATTOM Data Solutions).
- Iowa’s zombie share is the second highest of any state. In the third quarter of 2026, 118 Iowa properties in the foreclosure process were vacant, 7.8 percent of the total. Only Kansas had a higher share. ATTOM listed Black Hawk, Scott, Linn, and Polk counties in its Iowa entry.
- Polk County ranks first. Polk scores 69.3 and ranks in the top two in all five versions of the index. Its 90-day delinquency rate, 1.0 percent, is tied with Black Hawk County for the highest published rate of any Iowa county, and 26.7 percent of its listings carry a price cut.
- Seven counties grade Elevated in every version. Polk, Dickinson, Jasper, Webster, Boone, Woodbury, and Cerro Gordo hold the Elevated grade in all five versions. Dickinson and Cerro Gordo are second-home markets.
- Cedar Rapids, Davenport, and Dallas County score low. Linn County ranks last, Dallas County ranks 23rd, and Scott County ranks 21st. Linn and Scott grade Lower in every version, as do Sioux, Wapello, and Des Moines counties.
You're on the list.
We'll email you when the next report is out. One optional question so we can send the right research:

Methodology
Three limits to read first
We state these before the method because they shape how the Iowa results should be read.
Delinquency data for 6 of 24 ranked counties. The CFPB publishes a county’s 90-day delinquency rate only when the county has enough mortgages in its sample. In Iowa, six ranked counties qualify: Black Hawk (1.0 percent), Polk (1.0), Scott (0.8), Johnson (0.7), Linn (0.7), and Dallas (0.6). The other 18 carry the statewide rate of 0.9 percent, which sits near the top of that range, so it lifts their scores relative to the six counties with a measured rate. When we remove delinquency from the index, five counties that grade Elevated on the standard index, Black Hawk, Dubuque, Marshall, Clinton, and Story, fall to Moderate.
Two second-home counties. Median days on market is half of the market-softness input, and in second-home markets it is likely inflated by vacation homes that sit longer on the market. Statewide, 1.6 percent of Iowa homes are held for seasonal, recreational, or occasional use. We flag a county as a second-home market when that share is 5 percent or more, the same cutoff we used in Oklahoma. Two ranked counties clear it: Dickinson (33.8 percent) and Cerro Gordo (6.7 percent), home to Clear Lake. Lee County, at 1.4 percent, is the next ranked county below the line. Both flagged counties grade Elevated in every version of the index.
Unemployment estimates differ. The index uses the Census five-year unemployment estimate, which covers 2020 to 2024 and includes the pandemic shutdowns. In some counties it differs sharply from the current rate from the Bureau of Labor Statistics. In Jasper County it runs above the current rate, 5.7 percent against 3.3 percent, and in Story County, home to Ames, 4.8 percent against 2.9 percent. In Marshall County it runs below it, 4.3 percent against 5.9 percent. With current unemployment, Story falls from 14th to 17th and grades Lower, and we treat its grade as less firm.
We kept the standard formula anyway. Changing the method state by state would break the comparability that makes the series useful, and disclosing where the result is fragile is more useful to readers than tuning it away.
Data and sources
We built the index entirely from public and openly licensed data, and we cite each source at the point of use. Market conditions come from Realtor.com Economic Research (county listing data through September 2026). Housing tenure, mortgage status, cost burden, seasonal homes, county housing counts, and unemployment come from the U.S. Census Bureau’s American Community Survey five-year estimates (2020 to 2024). Mortgage delinquency comes from the Consumer Financial Protection Bureau’s Mortgage Performance Trends (latest data December 2025). Current county unemployment for the sensitivity test comes from the Bureau of Labor Statistics’ Local Area Unemployment Statistics. Statewide filing counts, national ranks, zombie foreclosures, and trends come from ATTOM Data Solutions’ published foreclosure market reports. Every dataset we used is free and publicly available.
Building the index
The Iowa Foreclosure Risk Index uses the same formula as every state in this series, a weighted blend of four signals, each chosen because it precedes or predicts foreclosure among homeowners who carry a mortgage:
35%
The share of active listings with a price cut and the median days a home sits on the market. A soft market matters because a homeowner in trouble who cannot sell quickly has fewer ways to avoid foreclosure. See the note on second-home counties above.
30%
The share of owners with a mortgage who spend 30 percent or more of household income on housing. This is direct payment stress on the exact population that can be foreclosed on.
20%
The 90-day-or-more delinquency rate, the clearest early warning that foreclosures are coming. Published for 6 of the 24 ranked counties. See the note above.
15%
A secondary driver. We hold its weight down deliberately, because unemployment also captures renters and therefore dilutes a signal meant to describe homeowners.
We ranked the 24 counties with at least 12,000 housing units. Smaller counties have few listings in a given month, which makes their market data noisy, and the 24 ranked counties hold 980,039 of Iowa’s 1,437,699 homes. We normalized each signal across the ranked counties on a 0-to-1 scale, where 0 is the lowest value in that set and 1 is the highest, then applied the weights above and multiplied by 100. The result is a relative score: it ranks Iowa counties against one another, not against a national or absolute standard. We then graded each county by its score, Elevated for 50.0 or above, Moderate for 44.0 to 49.9, and Lower for anything below 44.0. Fourteen counties land in the Elevated tier, three in Moderate, and seven in Lower. The 14 Elevated counties hold 39.0 percent of the state’s homes.
To test how much the results depend on any one input, we scored the counties five ways. The first is the standard index. The second swaps in current Bureau of Labor Statistics unemployment, the 12 published months from August 2025 through August 2026, for the Census five-year estimate. The third removes delinquency and spreads its weight proportionally across the other three signals. The fourth measures market softness by price cuts alone, and the fifth combines price cuts alone with current BLS unemployment. When we call a finding robust in this report, it holds in all five.
Other limitations
The index is relative. A grade describes a county’s position among Iowa’s ranked counties, not its risk in absolute terms. Iowa’s ranked counties sit close together on most inputs. Cost burden, for example, runs only from 17.2 percent to 24.3 percent across them, so normalizing within the state stretches small differences, and that is why 14 of the 24 grade Elevated. The index also measures leading pressure, not completed foreclosures or filings, so it will not match any single month’s filing counts. The 75 counties below the housing floor are not ranked, and the index says nothing about them. Counties that tie at the published one-decimal score share a rank.
Findings
The index
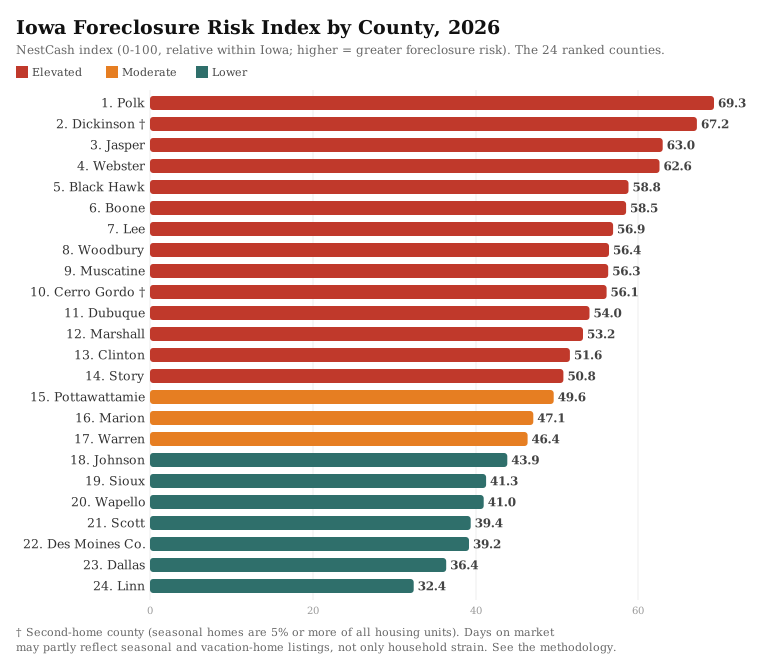
Ranked from most to least risk on the standard formula. Read the daggered second-home counties with the limits above in mind.
Polk County and the Des Moines area
Polk County, home to Des Moines and Ankeny, scores 69.3 and ranks first. It is the state’s largest county by number of homes, 218,486, and it ranks in the top two in all five versions of the index. It does not lead in every version: Dickinson ranks first with current unemployment and with delinquency removed, and Dubuque ranks first on price cuts combined with current unemployment. Polk’s score does not come from one extreme value. It ranks fourth of the 24 ranked counties on price cuts, at 26.7 percent of listings, and tied for seventh on median days on market, at 61 days. Its 90-day delinquency rate, 1.0 percent, is tied with Black Hawk County for the highest published rate of any Iowa county, and its five-year unemployment estimate, 4.4 percent, ranks sixth. Only on cost burden, 20.4 percent, does it sit in the middle of the ranked counties, at 12th. In the third quarter of 2026, ATTOM listed Polk among the four Iowa counties in its entry on zombie foreclosures.
The counties around Polk split. Jasper County, home to Newton, ranks third at 63.0 and grades Elevated in every version. It has the highest five-year unemployment estimate of any ranked county, 5.7 percent, and the third-highest price-cut share of any ranked county, 27.4 percent. Boone County ranks sixth at 58.5 and also grades Elevated in every version, with the second-highest price-cut share of any ranked county, 28.8 percent. Marion County, home to Knoxville and Pella, ranks 16th and Warren County, home to Indianola, ranks 17th, and both grade Moderate on the standard index. Dallas County, home to Waukee and Adel, ranks 23rd at 36.4. Its listings sit on the market longer than in any other ranked county, a median of 74 days, but its published delinquency rate, 0.6 percent, is the lowest of any Iowa county with a published rate. Dallas grades Lower in four of the five versions and Moderate when delinquency is removed.
Fort Dodge, Sioux City, and Waterloo
Webster County, home to Fort Dodge, ranks fourth at 62.6 and grades Elevated in every version. Its five-year unemployment estimate, 4.8 percent, is tied with Story County for the second-highest of any ranked county. Woodbury County, home to Sioux City, ranks eighth at 56.4, also Elevated in every version, with 25.5 percent of listings carrying a price cut. Black Hawk County, home to Waterloo and Cedar Falls, ranks fifth at 58.8. Its 1.0 percent delinquency rate is tied with Polk for the highest published rate, and ATTOM listed it among the four Iowa counties in its zombie foreclosure entry. Black Hawk grades Elevated in four versions and Moderate when delinquency is removed. In February 2026, John Deere announced it would recall 146 laid-off employees to its Waterloo Works plant starting in early March (Des Moines Register).
Spirit Lake and Mason City
Dickinson County, home to Spirit Lake and Okoboji, ranks second at 67.2. A third of its homes, 33.8 percent, are held for seasonal use, the highest share of any ranked county, and 24.3 percent of its homeowners with a mortgage spend 30 percent or more of their income on housing, the highest share of any ranked county. It ranks first with current unemployment and with delinquency removed, and eighth and 10th on the two price-cut versions, and it grades Elevated in all five. Its delinquency rate is not published. Cerro Gordo County, home to Mason City and Clear Lake, ranks 10th at 56.1 and grades Elevated in every version, and its listings have the second-longest median time on the market of any ranked county, 65 days.
Dubuque, Davenport, and Burlington
These eastern counties do not move together. Dubuque County ranks 11th at 54.0, and 30.8 percent of its listings carry a price cut, the highest share of any Iowa county. On price cuts alone it ranks second, and combined with current unemployment it ranks first, but it falls to Moderate when delinquency is removed. Clinton County ranks 13th and Muscatine County ninth, and Lee County, home to Fort Madison and Keokuk, ranks seventh at 56.9. Lee and Muscatine grade Elevated on the standard index but Moderate or Lower on the price-cut versions. Scott County, home to Davenport and Bettendorf, ranks 21st at 39.4, and Des Moines County, home to Burlington, ranks 22nd at 39.2. Both grade Lower in every version.
Cedar Rapids, Iowa City, and Ames
Linn County, home to Cedar Rapids and Marion, ranks last at 32.4 and grades Lower in every version. Only 12.7 percent of its listings carry a price cut, and its published delinquency rate is 0.7 percent. Johnson County, home to Iowa City, ranks 18th at 43.9, just below the Moderate line, and it has the second-lowest price-cut share of any ranked county, 10.7 percent. Story County, home to Ames, ranks 14th at 50.8 and grades Elevated on the standard index, but its grade rests partly on a five-year unemployment estimate well above the current rate, and it grades Lower with current unemployment.
Linn and Scott are a reminder that the index and the zombie count measure different things. Both grade Lower in every version, yet ATTOM listed both among the four Iowa counties in its third-quarter entry on zombie foreclosures, homes left vacant during the foreclosure process. The index describes pressure on mortgaged homeowners across a county. The zombie count describes a small number of homes already in foreclosure, 118 statewide.
Western and southern Iowa
Pottawattamie County, home to Council Bluffs, grades Moderate at 49.6 and ranks 15th. Its listings spend less time on the market than in any other ranked county, a median of 37 days, but it grades Elevated on both price-cut versions. Sioux County, home to Sioux Center and Rock Valley, ranks 19th and grades Lower in every version. In June 2024, flooding along the Rock River damaged 500 homes in Rock Valley (U.S. Geological Survey). Wapello County, home to Ottumwa, ranks 20th and also grades Lower in every version. In August 2026, ATTOM listed Jasper, Van Buren, Buena Vista, and Tama counties in its Iowa entry on foreclosure filings. Of those, only Jasper is large enough to be ranked.
How today compares with the last crisis
In 2009, 5,681 Iowa properties had a foreclosure filing, 0.43 percent of the state’s housing units, against 2.21 percent nationally. That rate ranked Iowa 43rd (RealtyTrac). The 2009 total was 5.50 percent higher than in 2008 and 38.46 percent higher than in 2007, so from those reported changes we estimate about 5,385 properties with a filing in 2008 and about 4,103 in 2007. The published year-end reports we use do not give Iowa totals for 2010 through 2025, so the chart shows those years as a gap rather than estimating them. At its first-half pace, Iowa is on track for about 4,400 properties with a filing in 2026, about 0.31 percent of its housing units, against about 0.32 percent nationally. That is fewer filings than in 2009, but a rate close to the national one, where in 2009 Iowa’s rate was about a fifth of it.
How Iowa compares with its neighbors
In the first half of 2026, Iowa’s foreclosure rate was one in 653 housing units (ATTOM Data Solutions). That was lower than in Illinois, where Jo Daviess County ranks first in our county index (one in 435). It was higher than in Minnesota, where our county index puts Aitkin County first (one in 809), Missouri, where Stone County leads our county index (one in 1,028), and Wisconsin, where Barron County ranks first in our county index (one in 1,537).
If you are an Iowa homeowner facing foreclosure
This report is a market analysis, not legal advice, but the data points to a few things worth knowing. Iowa foreclosures normally go through the courts: the court enters a judgment for the amount due and directs the home to be sold at a sheriff’s sale (Iowa Code § 654.5). Before a lender starts that process, or the notice-based procedure described below, on a one-family or two-family home that is the borrower’s residence, it must send a notice of the right to cure, and the borrower then generally has 30 days to cure the default, unless the lender is an individual or the borrower received a cure notice for another default within the past year (§ 654.2D). After a sale, the owner can usually redeem the home within one year (§ 628.3). For property of less than 10 acres, that period can be shortened to six months, or to three months for property not used for farming, if the mortgage provides for it and the lender waives any deficiency judgment (§ 628.26).
On property not used for farming, a lender can also ask for foreclosure without redemption. In that case the sale happens promptly after judgment unless the homeowner files a written demand to delay it, and for a one-family or two-family home that is the owner’s residence, the sale then waits six months, or three months if the lender waived a deficiency judgment (§ 654.20, § 654.21). If a lender instead uses Iowa’s notice-based nonjudicial procedure, the homeowner can stop it within 30 days of receiving the notice by curing the default or by filing a rejection with the county recorder and serving it as the statute requires, unless a court has found the property abandoned (§ 655A.3, § 655A.6).
Help is available. Iowa Mortgage Help, a free, state-sponsored mortgage counseling service, can be reached at 877-622-4866 (Iowa Mortgage Help). To apply for free legal help from Iowa Legal Aid, call 800-532-1275 (Iowa Legal Aid). The Attorney General’s Consumer Protection Division is at 515-281-5926, or 888-777-4590 outside the Des Moines metro area (Iowa Attorney General). A HUD-approved housing counselor can review your options: call (800) 569-4287 to find one near you (HUD).
The full data
The 24 ranked counties, from highest to lowest Foreclosure Risk Index. An asterisk on the delinquency rate marks a county where the Iowa statewide rate was substituted because its own rate is not separately reported. A dagger marks a second-home county, where seasonal homes are 5 percent or more of housing. Unemployment is the five-year Census estimate used in the index. Counties that tie at the published score share a rank.
| Rank | County | FRI | Grade | Price cuts | Median DOM | Cost burden | 90+ delinq | Unemployment |
|---|---|---|---|---|---|---|---|---|
| 1 | Polk | 69.3 | Elevated | 26.7% | 61 | 20.4% | 1.0% | 4.4% |
| 2 | Dickinson † | 67.2 | Elevated | 14.8% | 64 | 24.3% | 0.9*% | 3.0% |
| 3 | Jasper | 63.0 | Elevated | 27.4% | 58 | 19.2% | 0.9*% | 5.7% |
| 4 | Webster | 62.6 | Elevated | 24.7% | 57 | 20.5% | 0.9*% | 4.8% |
| 5 | Black Hawk | 58.8 | Elevated | 23.0% | 52 | 19.5% | 1.0% | 4.6% |
| 6 | Boone | 58.5 | Elevated | 28.8% | 59 | 21.3% | 0.9*% | 1.5% |
| 7 | Lee | 56.9 | Elevated | 12.4% | 62 | 21.3% | 0.9*% | 4.5% |
| 8 | Woodbury | 56.4 | Elevated | 25.5% | 46 | 20.7% | 0.9*% | 4.1% |
| 9 | Muscatine | 56.3 | Elevated | 10.0% | 57 | 23.3% | 0.9*% | 3.2% |
| 10 | Cerro Gordo † | 56.1 | Elevated | 19.3% | 65 | 21.0% | 0.9*% | 2.6% |
| 11 | Dubuque | 54.0 | Elevated | 30.8% | 39 | 20.2% | 0.9*% | 3.7% |
| 12 | Marshall | 53.2 | Elevated | 18.2% | 41 | 21.8% | 0.9*% | 4.3% |
| 13 | Clinton | 51.6 | Elevated | 24.4% | 52 | 19.7% | 0.9*% | 3.4% |
| 14 | Story | 50.8 | Elevated | 19.1% | 51 | 19.5% | 0.9*% | 4.8% |
| 15 | Pottawattamie | 49.6 | Moderate | 19.8% | 37 | 21.5% | 0.9*% | 3.8% |
| 16 | Marion | 47.1 | Moderate | 22.6% | 61 | 19.0% | 0.9*% | 2.2% |
| 17 | Warren | 46.4 | Moderate | 17.2% | 62 | 18.8% | 0.9*% | 3.4% |
| 18 | Johnson | 43.9 | Lower | 10.7% | 64 | 21.3% | 0.7% | 3.8% |
| 19 | Sioux | 41.3 | Lower | 13.8% | 60 | 20.1% | 0.9*% | 1.5% |
| 20 | Wapello | 41.0 | Lower | 15.4% | 54 | 18.0% | 0.9*% | 4.3% |
| 21 | Scott | 39.4 | Lower | 19.1% | 44 | 19.7% | 0.8% | 3.7% |
| 22 | Des Moines | 39.2 | Lower | 22.4% | 54 | 17.2% | 0.9*% | 3.1% |
| 23 | Dallas | 36.4 | Lower | 20.5% | 74 | 18.9% | 0.6% | 2.3% |
| 24 | Linn | 32.4 | Lower | 12.7% | 41 | 21.0% | 0.7% | 3.5% |
What we will watch
We plan to update this index quarterly, beginning with the first quarter of 2027. Three things will tell us where Iowa goes from here. The first is whether the statewide delinquency rate, which rose from 0.6 percent at the end of 2023 to 0.9 percent at the end of 2025, keeps rising. The second is whether Iowa’s zombie share stays well above the national share. The third is whether Polk and Black Hawk counties, the two with the highest published delinquency rates, pull further away from the rest of the state. The farm economy is a fourth question the index does not measure directly. Iowa State University’s 2025 survey put average farmland values at $11,549 an acre, up 0.7 percent from a year earlier but down 1.8 percent after inflation.
Sources and data
- Foreclosure activity and trend. ATTOM Data Solutions, 2026 Mid-Year U.S. Foreclosure Market Report (published July 16, 2026), U.S. Foreclosure Rates by State, August 2026 (published September 18, 2026), and Zombie Foreclosure Rates by State, Q3 2026 (published September 4, 2026). Used for statewide filing counts, the national rank, the one-year and two-year changes, the zombie share and count, and the counties listed for August filings and third-quarter zombie foreclosures.
- Historical record. RealtyTrac, 2009 Year-End Foreclosure Market Report (via the Financial Crisis Inquiry Commission archive). Used for the 2009 total, rate, and rank, and the changes from 2008 and 2007.
- Housing market softness. Realtor.com Economic Research, county inventory core metrics through September 2026.
- Housing, mortgage status, cost burden, seasonal homes, and unemployment. U.S. Census Bureau, American Community Survey five-year estimates, 2020 to 2024.
- Current unemployment. U.S. Bureau of Labor Statistics, Local Area Unemployment Statistics, the 12 published months from August 2025 through August 2026 (BLS published no October 2025 figures). Used for the sensitivity test and the current-rate comparisons.
- Mortgage delinquency. CFPB Mortgage Performance Trends, state and county data through December 2025. Used for the 90-or-more day delinquency rates and the national comparison.
- Local context. U.S. Geological Survey, Floods of June 2024 in Northwestern Iowa (Open-File Report 2026-1066); Iowa State University, 2025 Land Value Survey; and the Des Moines Register, John Deere recall at Waterloo Works (February 6, 2026).
- Foreclosure process. Iowa Code § 654.5, § 654.2D, § 628.3, § 628.26, § 654.20, § 654.21, § 655A.3, and § 655A.6. Help resources from Iowa Mortgage Help, Iowa Legal Aid, the Iowa Attorney General, and HUD.
About NestCash
NestCash buys houses for cash in twelve states and publishes original housing and distressed-property research across U.S. markets. Our original housing research helps homeowners, buyers, and investors understand local market conditions. This report may be cited and its charts embedded with attribution to NestCash.

John is the Founder of NestCash and a leading voice in real estate investing and housing market strategy. With experience across 12 states, he helps buyers, sellers, and investors make smarter decisions using real-world insight and market data.
You're on the list.
We'll email you when the next report is out. One optional question so we can send the right research: