
The 2026 Wisconsin Foreclosure Risk Index
Where financial pressure on Wisconsin homeowners is building, county by county
 Published on October 14th, 2026, by John Carter | Founder, NestCash
Original NestCash research, free to read and cite.

Abstract
Wisconsin is one of the calmest foreclosure markets in the country. In the first half of 2026, 1,808 Wisconsin properties had a foreclosure filing, one for every 1,537 housing units, the 44th-highest rate of any state and well under half the national rate of one in 632. Filings were up 5 percent from the first half of 2025 and 17 percent from the first half of 2024, against national increases of 21 and 28 percent (ATTOM Data Solutions). At the end of 2025, 0.5 percent of Wisconsin mortgages were 90 or more days delinquent, tied with California for the lowest rate of any state and well below the national 0.9 percent and neighboring Illinois at 1.1 percent (Consumer Financial Protection Bureau). In late 2024 Wisconsin foreclosures took an average of 1,989 days to complete, the fourth longest in the nation, though the state has since dropped out of ATTOM’s five slowest.
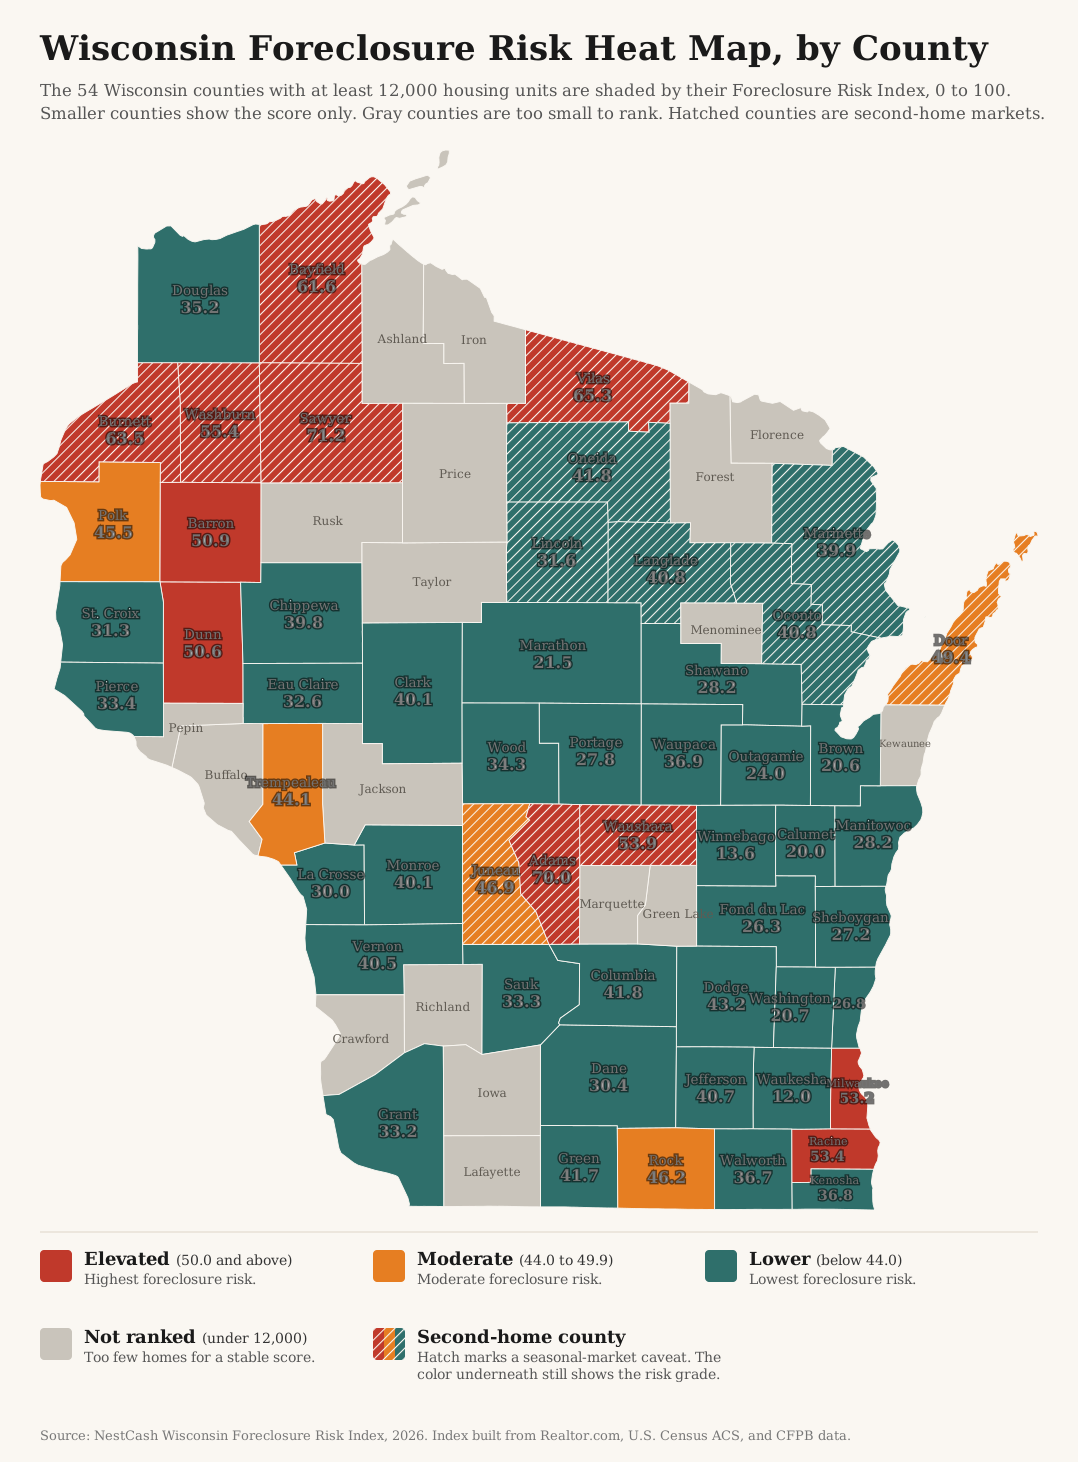
We built a county-level Foreclosure Risk Index from four public datasets to see where the pressure that does exist is concentrated. It sits in two very different places. The first is the lake country of the Northwoods and the Central Sands, where Sawyer, Adams, Vilas, Burnett, and Bayfield counties lead the index. These are second-home markets, where slow-moving listings of cabins and lake homes likely inflate part of the score, and we flag them throughout the report. The second is southeastern Wisconsin, where Racine and Milwaukee counties grade Elevated with measured delinquency rates above the state’s. When we score only the year-round counties against one another, Barron, Milwaukee, and Racine lead, and all three grade Elevated in every version of that ranking we tested. The suburbs at the other end of the state’s largest metro score lowest: Waukesha County, west of Milwaukee, is last in the state at 12.0, with the lowest published delinquency rate in Wisconsin, 0.2 percent.
We score each county from 0 to 100 by blending four public signals, each weighted by how directly it bears on a mortgaged homeowner: market softness (35 percent), mortgage cost burden (30 percent), 90-day mortgage delinquency (20 percent), and unemployment (15 percent). Each signal is min-max normalized within Wisconsin, so the score ranks counties against one another in the state, not against a national or absolute standard. In a state with Wisconsin’s low foreclosure rate, an Elevated grade means higher pressure than the rest of Wisconsin, not a crisis. A county grades Elevated at 50 or above, Moderate from 44 to 49.9, and Lower below 44. One rule keeps the ranking honest: we rank the 54 counties with at least 12,000 housing units. Wisconsin has 72 counties, and the other 18 have too few homes for sale to score a market reliably, so they stay in the data but are not ranked. The 54 ranked counties hold 94.8 percent of the state’s homes. Because so many of the top-ranked counties are second-home markets, we flag them and also publish a supplementary ranking of the 40 year-round counties. We tested both rankings five different ways and report which findings hold in all of them. The full weighting, the normalization, and the limits of the data are spelled out in the methodology section below.
Key findings
- Wisconsin’s foreclosure rate is low and barely rising. It ranked 44th by foreclosure rate in the first half of 2026 and 46th in August, one filing for every 11,204 housing units. First-half filings were up 17 percent from two years earlier, against 28 percent nationally (ATTOM Data Solutions).
- The top of the index is lake country. Sawyer (71.2), Adams (70.0), Vilas (65.3), Burnett (63.5), and Bayfield (61.6) counties rank first through fifth and grade Elevated in all five versions of the index. All five are second-home markets, where 38 to 51 percent of homes are held for seasonal use, and four of them, Adams, Vilas, Sawyer, and Burnett, carry the four heaviest housing cost burdens of any ranked county. Read their scores with the limits below in mind.
- Racine and Milwaukee are the year-round story. Racine (53.4) and Milwaukee (53.2) grade Elevated with delinquency rates of 0.7 percent, among the highest published rates in the state, and they are two of the four counties ATTOM named for zombie foreclosures in the third quarter of 2026. Among year-round counties they rank third and second, and they grade Elevated in all five versions of that ranking.
- Barron and Dunn lead the west. Barron County (50.9) ranks 10th statewide, just behind Racine and Milwaukee, and first among year-round counties. Dunn County (50.6), home to Menomonie, has the highest share of listings with a price cut of any ranked county, 30.0 percent.
- The Milwaukee suburbs and the Fox Valley score lowest. Waukesha (12.0) is last in the state, Winnebago (13.6), home to Oshkosh, is second to last, and Calumet, Brown, Washington, and Marathon complete the bottom six.
Methodology
Three limits to read first
We state these before the method because they shape how the Wisconsin results should be read.
Second-home counties lead the index. Median days on market is half of the market-softness input, and in Wisconsin’s lake counties it is likely inflated by cabins and vacation homes that sit longer on the market. Statewide, 6.2 percent of Wisconsin’s homes are held for seasonal, recreational, or occasional use, and the 5 percent cutoff we have used in several states would flag 40 of Wisconsin’s 72 counties. As in our Utah and New York indexes, we instead flag counties at three times the statewide share, 18.7 percent. Fourteen ranked counties clear that line: Vilas (51.4 percent), Burnett (51.2), Sawyer (41.8), Bayfield (39.1), Oneida (39.0), Adams (38.3), Washburn (36.8), Door (35.2), Marinette (31.1), Oconto (26.1), Waushara (23.1), Langlade (20.9), Juneau (20.2), and Lincoln (18.8). Polk County, at 16.6 percent, is the next ranked county below the line. Seven of the 11 Elevated counties are on the list. Their high scores do not rest on days on market alone: the four heaviest housing cost burdens of any ranked county belong to Adams, Vilas, Sawyer, and Burnett, and six of the seven stay Elevated in every version of the index. But because seasonal ownership touches every market input in these counties, we also publish a supplementary ranking of the 40 year-round counties, using the same formula scored only against one another, in its own section below and as the last column of the full data table.
Delinquency data for 11 of 54 ranked counties. The CFPB publishes a county’s 90-day delinquency rate only when the county has enough mortgages in its sample. In Wisconsin, 11 ranked counties qualify: Milwaukee, Dane, Waukesha, Brown, Racine, Outagamie, Winnebago, Kenosha, Rock, Marathon, and Washington. The other 43, including every second-home county and Barron and Dunn, carry the statewide rate of 0.5 percent. Their scores therefore rest on market softness, cost burden, and unemployment, not on a measured delinquency rate.
A low-foreclosure state. The index ranks counties against one another. Wisconsin’s foreclosure and delinquency rates are among the lowest in the country, so a county that grades Elevated here would not necessarily stand out in a higher-risk state. The grades describe where pressure is building within Wisconsin.
We kept the standard formula anyway. Changing the method state by state would break the comparability that makes the series useful, and disclosing where the result is fragile is more useful to readers than tuning it away.
Data and sources
We built the index entirely from public and openly licensed data, and we cite each source at the point of use. Market conditions come from Realtor.com Economic Research (county listing data through September 2026). Housing tenure, mortgage status, cost burden, seasonal homes, county housing counts, and unemployment come from the U.S. Census Bureau’s American Community Survey five-year estimates (2020 to 2024). Mortgage delinquency comes from the Consumer Financial Protection Bureau’s Mortgage Performance Trends (latest data December 2025). Current county unemployment for the sensitivity test comes from the Bureau of Labor Statistics’ Local Area Unemployment Statistics. Statewide filing counts, national ranks, and trends come from ATTOM Data Solutions’ published foreclosure market reports. Every dataset we used is free and publicly available.
Building the index
The Wisconsin Foreclosure Risk Index uses the same formula as every state in this series, a weighted blend of four signals, each chosen because it precedes or predicts foreclosure among homeowners who carry a mortgage:
35%
The share of active listings with a price cut and the median days a home sits on the market. A soft market matters because a homeowner in trouble who cannot sell quickly has fewer ways to avoid foreclosure. See the note on second-home counties above.
30%
The share of owners with a mortgage who spend 30 percent or more of household income on housing. This is direct payment stress on the exact population that can be foreclosed on.
20%
The 90-day-or-more delinquency rate, the clearest early warning that foreclosures are coming. Published for 11 of Wisconsin’s 54 ranked counties. See the note above.
15%
A secondary driver. We hold its weight down deliberately, because unemployment also captures renters and therefore dilutes a signal meant to describe homeowners.
We normalized each signal across the 54 ranked counties on a 0-to-1 scale, where 0 is the lowest value in that set and 1 is the highest, then applied the weights above and multiplied by 100. The result is a relative score: it ranks Wisconsin counties against one another, not against a national or absolute standard. We then graded each county by its score, Elevated for 50.0 or above, Moderate for 44.0 to 49.9, and Lower for anything below 44.0. Eleven counties land in the Elevated tier, five in Moderate, and 38 in Lower. The 11 Elevated counties hold 24.1 percent of the state’s homes, most of them in Milwaukee and Racine counties.
To test how much the results depend on any one input, we scored the counties five ways: the standard index; the standard index with current Bureau of Labor Statistics unemployment, the 12 published months from August 2025 through August 2026, in place of the Census five-year estimate; the index with delinquency removed and its weight spread proportionally across the other three signals; the index with market softness measured by price cuts alone; and price cuts alone combined with current BLS unemployment. We ran the same five tests on the year-round ranking. When we call a finding robust in this report, it holds in all five.
Other limitations
The index is relative. A Lower grade means lower measured risk than other Wisconsin counties, not low risk in absolute terms. It also measures leading pressure, not completed foreclosures or filings, so it will not match any single month’s filing counts. ATTOM’s August 2026 state rankings listed Kewaunee, Taylor, Dodge, and Langlade counties under Wisconsin, a month with only 248 filings statewide. Dodge grades Lower on our index at 43.2, just under the Moderate line, and ranks seventh among year-round counties. Langlade grades Lower and is a second-home county, and Kewaunee and Taylor are below our 12,000-home floor. Counties that tie at the published one-decimal score share a rank.
Findings
The index
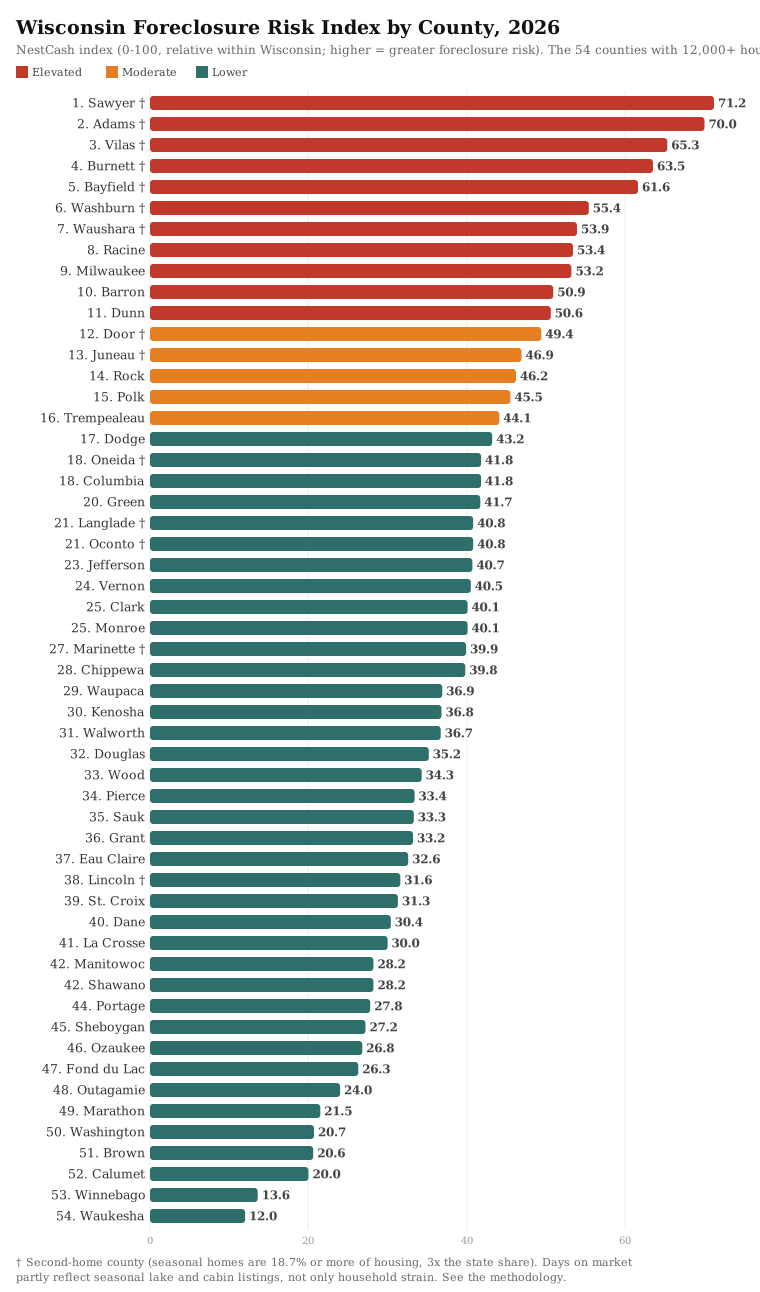
Ranked from most to least risk on the standard formula. Read the daggered second-home counties with the limits above in mind.
The Northwoods and the Central Sands
The five highest scores among Wisconsin’s ranked counties belong to lake-country counties. Sawyer County, home to Hayward, ranks first at 71.2, and Adams County, in the Central Sands south of Wausau, is second at 70.0, just 1.2 points behind. Vilas, Burnett, and Bayfield follow. All five grade Elevated in every version of the index we tested, and Vilas ranks first when market softness is measured by price cuts alone.
These counties have real pressure on year-round homeowners. Their owners carry the heaviest housing cost burdens of any ranked counties: 31.7 percent in Adams, 31.5 percent in Vilas, 30.4 percent in Sawyer, and 30.0 percent in Burnett, against a median of 22.7 percent across the 54 ranked counties. Sawyer’s five-year unemployment estimate, 6.0 percent, is the highest of any ranked county, though its current 12-month rate is lower, at 4.2 percent. Adams County also had the steepest rise in foreclosure filings in the state going into the last crisis, 80 percent from 2007 to 2008 (Wisconsin Court System). But these are also among the most seasonal housing markets in Wisconsin, where 38 to 51 percent of homes are held for seasonal use, and none of them has a published delinquency rate. Washburn County, sixth at 55.4, shows how much the seasonal market can move a score. Its homes sit on the market a median of 100 days, the longest in the state, and it falls to Lower when market softness is measured by price cuts alone. Door County (49.4), the peninsula resort county, grades Moderate and falls to Lower on price cuts as well.
Milwaukee and Racine
Racine County ranks eighth statewide at 53.4 and Milwaukee County ninth at 53.2, both Elevated. They are different from the counties above them. Their homes move quickly, sitting on the market a median of 33 and 37 days, but their delinquency rates, 0.7 percent each, are among the highest published rates in Wisconsin, and Milwaukee’s five-year unemployment rate, 4.8 percent, is the third highest of any ranked county. Both grade Elevated in four of the five versions of the statewide index, falling to Moderate only when delinquency is removed, and both rank higher when market softness is measured by price cuts alone. In its third-quarter 2026 report on zombie foreclosures, homes left vacant during the foreclosure process, ATTOM’s Wisconsin entry named four counties: Milwaukee, Racine, Winnebago, and Rock.
Milwaukee County is also where the last crisis was concentrated. In 2007 it held 16 percent of Wisconsin’s housing but 25 percent of the state’s foreclosure cases (University of Wisconsin Applied Population Laboratory). On our Vacant & Abandoned Property Index, Milwaukee grades Moderate, and Wisconsin as a whole ranks 45th of the 50 states and the District of Columbia.
Kenosha County, the third county in the corner, grades Lower at 36.8 on the statewide index and Moderate in the year-round ranking. Rock County, home to Janesville and Beloit, has the highest published delinquency rate in the state, 0.8 percent, and grades Moderate at 46.2.
The year-round ranking
When we score the 40 ranked counties that are not second-home markets against one another, the leaders are a western county and the two southeastern metros:
| Year-round rank | County | Score | Grade |
|---|---|---|---|
| 1 | Barron | 69.1 | Elevated |
| 2 | Milwaukee | 68.6 | Elevated |
| 3 | Racine | 68.3 | Elevated |
| 4 | Dunn | 63.5 | Elevated |
| 5 | Polk | 61.2 | Elevated |
| 6 | Clark | 57.6 | Elevated |
| 7 | Dodge | 57.5 | Elevated |
| 8 | Green | 57.4 | Elevated |
| 9 | Trempealeau | 56.1 | Elevated |
| 10 | Rock | 55.5 | Elevated |
Because the ranking scores counties only against one another, more of them reach the Elevated tier than on the statewide index, and the grades should be read as a ranking of year-round counties, not as a second statewide grade. Nine counties grade Elevated in all five versions of the year-round ranking: Barron, Milwaukee, Racine, Dunn, Polk, Trempealeau, Vernon, Columbia, and Chippewa. Barron County, home to Rice Lake, ranks first, and on the statewide index it is the highest-ranked year-round county outside Milwaukee and Racine. Dunn County, home to Menomonie, has the highest share of listings with a price cut of any ranked county, 30.0 percent, and Trempealeau, south of Eau Claire, the second highest, 26.1 percent. Clark, Dodge, Green, Jefferson, and Rock are less certain. Clark, Green, and Jefferson drop out of the Elevated tier when market softness is measured by price cuts alone, and Clark falls to Lower. Dodge drops to Moderate with current BLS unemployment, and Rock drops to Moderate with delinquency removed. The year-round rank for every county is in the last column of the full data table.
Madison, the Fox Valley, and the Milwaukee suburbs
The lowest scores of any ranked Wisconsin county belong to its suburban and mid-sized-city counties. Waukesha County, west of Milwaukee, is last in the state at 12.0, with the lowest published delinquency rate in Wisconsin, 0.2 percent, and it is last in four of the five versions of the index. Winnebago County, home to Oshkosh, is second to last at 13.6, though ATTOM named it among the state’s zombie-foreclosure counties in the third quarter. Brown County (20.6), home to Green Bay, Calumet (20.0), Washington (20.7), and Marathon (21.5), home to Wausau, complete the bottom six. Dane County, home to Madison, grades Lower at 30.4, with the second-lowest published delinquency rate in the state, 0.3 percent. Outagamie County, home to Appleton, grades Lower at 24.0 even though its 0.7 percent delinquency rate is among the highest published in Wisconsin.
How today compares with the last crisis
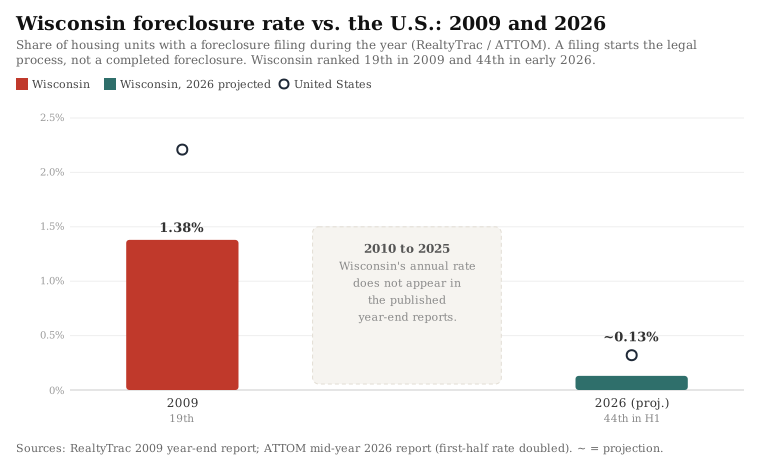
Wisconsin was a mid-table state in the foreclosure crisis. In 2009, 35,252 Wisconsin properties received a foreclosure filing, 1.38 percent of the state’s housing against 2.21 percent nationally, which ranked Wisconsin 19th among the states (RealtyTrac). The state’s courts counted the rise as it happened: foreclosure filings in Wisconsin circuit courts, excluding Portage County, climbed from 21,051 in 2007 to 25,474 in 2008 (Wisconsin Court System). The published year-end reports we use do not give Wisconsin’s annual rate for 2010 through 2025, so we cannot say whether 2009 was the state’s peak, and the chart below shows that gap rather than estimating it. At its first-half pace, Wisconsin is on track for a 2026 foreclosure rate of roughly 0.13 percent of homes, less than a tenth of its 2009 rate and well under the national pace of about 0.32 percent.
Wisconsin has also been one of the slower states to complete a foreclosure. In the fourth quarter of 2024 a Wisconsin foreclosure took an average of 1,989 days, the fourth longest in the country, behind Louisiana, Hawaii, and New York. By the fourth quarter of 2025, and again in the second quarter of 2026, Wisconsin was no longer among the five slowest states (ATTOM Data Solutions). A long process gives a homeowner more time to catch up or sell, but it also means a home can sit in limbo for years.
If you are a Wisconsin homeowner facing foreclosure
This report is a market analysis, not legal advice, but the data points to a few things worth knowing. Wisconsin forecloses through the courts. A lender must obtain a judgment of foreclosure, and for an owner-occupied home of one to four units the sale cannot happen until a waiting period after the judgment has passed. For a mortgage signed on or after April 27, 2016, that period is six months, or eight months if, on your motion before judgment, the court finds you are trying in good faith to sell the home and have signed a listing agreement with a licensed real estate broker. For an older mortgage it is 12 months (Wis. Stat. § 846.10). The period is shorter, three months for a mortgage signed on or after April 27, 2016 (five if you are listing the home with a broker) or six months for an older mortgage, when the lender gives up any claim for a deficiency judgment under a provision you agreed to when you signed the mortgage (§ 846.101), and a court can allow a sale after five weeks if it finds the home has been abandoned (§ 846.102).
Until the court confirms the sale, you can keep the home by paying the full amount of the judgment with interest, costs, and taxes (§ 846.13). If the home sells for less than the debt, the court may not confirm the sale or enter a deficiency judgment until it is satisfied that the fair value of the home has been credited against the debt (§ 846.16).
Free help is available, though some of it has changed recently. A HUD-approved housing counselor can review your options. Call (800) 569-4287 to find one near you (HUD), or use the CFPB’s housing counselor search. Legal Action of Wisconsin, which merged with Judicare Legal Aid on January 1, 2026, provides free civil legal help statewide at (855) 947-2529 (Legal Action of Wisconsin). Homeowners who are behind on their mortgage and under 80 percent of their county’s median income may qualify for help from the Foundation for Rural Housing, which serves every county except Dane, Racine, and Milwaukee (Foundation for Rural Housing). WHEDA offers loss-mitigation options to its own borrowers at 800-334-6873 (WHEDA). The Wisconsin Department of Financial Institutions takes complaints about mortgage bankers and brokers at (608) 261-7578 (DFI). Two resources that older guides still list are gone. The state’s Wisconsin Help for Homeowners program closed on March 8, 2024 (Wisconsin Department of Administration), and Mediate Milwaukee, which ran the Wisconsin Foreclosure Mediation Network, closed in late 2025 (MediateWisconsin). Ask the court handling your case whether a local mediation program is available. Be wary of anyone who charges up-front fees to stop a foreclosure or asks you to sign over the deed to your home.
The full data
All 54 ranked counties, from highest to lowest Foreclosure Risk Index. An asterisk on the delinquency rate marks a county where the Wisconsin statewide rate was substituted because its own rate is not separately reported. A dagger marks a second-home county, where seasonal homes are 18.7 percent or more of housing. Unemployment is the five-year Census estimate used in the index. The last column gives each county’s rank among the 40 year-round counties (n/a for second-home counties). Counties that tie at the published score share a rank.
| Rank | County | FRI | Grade | Price cuts | Median DOM | Cost burden | 90+ delinq | Unemployment | Year-round rank |
|---|---|---|---|---|---|---|---|---|---|
| 1 | Sawyer † | 71.2 | Elevated | 21.2% | 69 | 30.4% | 0.5*% | 6.0% | n/a |
| 2 | Adams † | 70.0 | Elevated | 19.7% | 81 | 31.7% | 0.5*% | 4.5% | n/a |
| 3 | Vilas † | 65.3 | Elevated | 24.6% | 54 | 31.5% | 0.5*% | 4.0% | n/a |
| 4 | Burnett † | 63.5 | Elevated | 16.3% | 76 | 30.0% | 0.5*% | 4.9% | n/a |
| 5 | Bayfield † | 61.6 | Elevated | 22.9% | 77 | 28.4% | 0.5*% | 3.6% | n/a |
| 6 | Washburn † | 55.4 | Elevated | 13.3% | 100 | 26.3% | 0.5*% | 3.9% | n/a |
| 7 | Waushara † | 53.9 | Elevated | 22.2% | 58 | 26.8% | 0.5*% | 3.9% | n/a |
| 8 | Racine | 53.4 | Elevated | 20.1% | 33 | 26.5% | 0.7% | 4.4% | 3 |
| 9 | Milwaukee | 53.2 | Elevated | 19.2% | 37 | 25.6% | 0.7% | 4.8% | 2 |
| 10 | Barron | 50.9 | Elevated | 22.8% | 66 | 26.1% | 0.5*% | 2.8% | 1 |
| 11 | Dunn | 50.6 | Elevated | 30.0% | 51 | 21.8% | 0.5*% | 4.4% | 4 |
| 12 | Door † | 49.4 | Moderate | 11.2% | 80 | 29.5% | 0.5*% | 2.4% | n/a |
| 13 | Juneau † | 46.9 | Moderate | 13.5% | 66 | 26.5% | 0.5*% | 3.8% | n/a |
| 14 | Rock | 46.2 | Moderate | 20.3% | 40 | 21.6% | 0.8% | 3.8% | 10 |
| 15 | Polk | 45.5 | Moderate | 19.3% | 48 | 26.2% | 0.5*% | 3.4% | 5 |
| 16 | Trempealeau | 44.1 | Moderate | 26.1% | 50 | 24.3% | 0.5*% | 2.3% | 9 |
| 17 | Dodge | 43.2 | Lower | 19.2% | 46 | 24.7% | 0.5*% | 3.8% | 7 |
| 18 | Oneida † | 41.8 | Lower | 21.0% | 58 | 25.0% | 0.5*% | 2.0% | n/a |
| 18 | Columbia | 41.8 | Lower | 22.1% | 59 | 22.4% | 0.5*% | 3.1% | 13 |
| 20 | Green | 41.7 | Lower | 17.2% | 65 | 22.9% | 0.5*% | 3.6% | 8 |
| 21 | Langlade † | 40.8 | Lower | 24.3% | 44 | 22.1% | 0.5*% | 3.5% | n/a |
| 21 | Oconto † | 40.8 | Lower | 25.4% | 52 | 23.3% | 0.5*% | 2.0% | n/a |
| 23 | Jefferson | 40.7 | Lower | 17.6% | 58 | 23.1% | 0.5*% | 3.6% | 11 |
| 24 | Vernon | 40.5 | Lower | 17.5% | 50 | 26.0% | 0.5*% | 2.5% | 12 |
| 25 | Clark | 40.1 | Lower | 12.5% | 70 | 23.4% | 0.5*% | 3.7% | 6 |
| 25 | Monroe | 40.1 | Lower | 19.8% | 43 | 24.4% | 0.5*% | 3.2% | 14 |
| 27 | Marinette † | 39.9 | Lower | 18.9% | 48 | 23.7% | 0.5*% | 3.4% | n/a |
| 28 | Chippewa | 39.8 | Lower | 22.7% | 50 | 22.3% | 0.5*% | 3.1% | 15 |
| 29 | Waupaca | 36.9 | Lower | 18.2% | 51 | 23.3% | 0.5*% | 2.8% | 16 |
| 30 | Kenosha | 36.8 | Lower | 21.0% | 32 | 23.1% | 0.4% | 4.4% | 18 |
| 31 | Walworth | 36.7 | Lower | 18.0% | 52 | 23.0% | 0.5*% | 2.9% | 17 |
| 32 | Douglas | 35.2 | Lower | 25.5% | 48 | 19.1% | 0.5*% | 3.1% | 23 |
| 33 | Wood | 34.3 | Lower | 17.6% | 46 | 20.8% | 0.5*% | 4.0% | 20 |
| 34 | Pierce | 33.4 | Lower | 20.4% | 54 | 19.6% | 0.5*% | 3.2% | 22 |
| 35 | Sauk | 33.3 | Lower | 16.1% | 69 | 21.2% | 0.5*% | 2.3% | 19 |
| 36 | Grant | 33.2 | Lower | 17.9% | 57 | 20.4% | 0.5*% | 3.1% | 21 |
| 37 | Eau Claire | 32.6 | Lower | 21.9% | 50 | 19.4% | 0.5*% | 3.0% | 26 |
| 38 | Lincoln † | 31.6 | Lower | 14.4% | 60 | 20.6% | 0.5*% | 3.2% | n/a |
| 39 | St. Croix | 31.3 | Lower | 15.9% | 47 | 22.5% | 0.5*% | 2.6% | 25 |
| 40 | Dane | 30.4 | Lower | 20.9% | 55 | 22.4% | 0.3% | 2.4% | 24 |
| 41 | La Crosse | 30.0 | Lower | 13.4% | 45 | 22.3% | 0.5*% | 3.1% | 26 |
| 42 | Manitowoc | 28.2 | Lower | 19.2% | 36 | 20.9% | 0.5*% | 2.6% | 31 |
| 42 | Shawano | 28.2 | Lower | 15.7% | 42 | 21.7% | 0.5*% | 2.6% | 28 |
| 44 | Portage | 27.8 | Lower | 16.7% | 52 | 18.8% | 0.5*% | 3.2% | 30 |
| 45 | Sheboygan | 27.2 | Lower | 18.8% | 38 | 20.2% | 0.5*% | 2.7% | 32 |
| 46 | Ozaukee | 26.8 | Lower | 11.0% | 36 | 23.5% | 0.5*% | 2.8% | 29 |
| 47 | Fond du Lac | 26.3 | Lower | 17.3% | 47 | 18.4% | 0.5*% | 3.2% | 33 |
| 48 | Outagamie | 24.0 | Lower | 14.4% | 38 | 17.4% | 0.7% | 2.7% | 35 |
| 49 | Marathon | 21.5 | Lower | 19.4% | 45 | 17.6% | 0.4% | 2.9% | 36 |
| 50 | Washington | 20.7 | Lower | 15.1% | 40 | 20.4% | 0.4% | 2.5% | 34 |
| 51 | Brown | 20.6 | Lower | 17.9% | 42 | 18.7% | 0.4% | 2.6% | 37 |
| 52 | Calumet | 20.0 | Lower | 14.8% | 46 | 18.6% | 0.5*% | 2.1% | 38 |
| 53 | Winnebago | 13.6 | Lower | 14.5% | 36 | 18.3% | 0.4% | 2.2% | 40 |
| 54 | Waukesha | 12.0 | Lower | 14.8% | 37 | 20.3% | 0.2% | 2.3% | 39 |
Eighteen counties are not ranked because they fall below the 12,000-housing-unit floor: Ashland, Buffalo, Crawford, Florence, Forest, Green Lake, Iowa, Iron, Jackson, Kewaunee, Lafayette, Marquette, Menominee, Pepin, Price, Richland, Rusk, and Taylor.
What we will watch
We plan to update this index quarterly, beginning with the first quarter of 2027. Three things will tell us where Wisconsin goes from here: whether the statewide delinquency rate, which edged up from 0.4 percent at the end of 2023 to 0.5 percent at the end of 2024 and held there through 2025, starts to climb; whether Milwaukee and Racine, the two Elevated counties with measured delinquency, move further up or back toward the middle; and whether the lake counties at the top of the index see their price cuts and days on market ease as the seasonal market turns over.
Sources and data
- Foreclosure activity and trend. ATTOM Data Solutions, 2026 Mid-Year U.S. Foreclosure Market Report, U.S. Foreclosure Rates by State, August 2026 (published September 18, 2026), and Zombie Foreclosure Rates by State, Q3 2026 (published September 4, 2026). Used for statewide filing counts, national ranks, the one-year and two-year changes, and the counties named for August filing rates and third-quarter zombie foreclosures.
- Historical rate, court filings, and timelines. RealtyTrac, 2009 Year-End Foreclosure Market Report (via the Financial Crisis Inquiry Commission archive); the Wisconsin Court System (January 14, 2009) for 2007 and 2008 circuit court filings; the University of Wisconsin Applied Population Laboratory, Population Notes (December 2008), for Milwaukee County’s share of 2007 cases; and ATTOM’s 2024 Year-End U.S. Foreclosure Market Report for the fourth-quarter 2024 timeline.
- Housing market softness. Realtor.com Economic Research, county inventory core metrics through September 2026.
- Housing, mortgage status, cost burden, seasonal homes, and unemployment. U.S. Census Bureau, American Community Survey five-year estimates, 2020 to 2024.
- Current unemployment. U.S. Bureau of Labor Statistics, Local Area Unemployment Statistics, the 12 published months from August 2025 through August 2026 (BLS published no October 2025 figures). Used only for the sensitivity test.
- Mortgage delinquency. CFPB Mortgage Performance Trends, state and county data through December 2025. Used for the 90-or-more day delinquency rates and the national and state comparisons.
- Foreclosure process. Wisconsin Statutes sections 846.10, 846.101, 846.102, 846.13, and 846.16. Help resources from HUD, Legal Action of Wisconsin, the Foundation for Rural Housing, WHEDA, the Department of Financial Institutions, the Department of Administration, and MediateWisconsin.
About NestCash
NestCash buys houses for cash in twelve states and publishes original housing and distressed-property research across U.S. markets. Our original housing research helps homeowners, buyers, and investors understand local market conditions. This report may be cited and its charts embedded with attribution to NestCash.

John is the Founder of NestCash and a leading voice in real estate investing and housing market strategy. With experience across 12 states, he helps buyers, sellers, and investors make smarter decisions using real-world insight and market data.