
The 2026 Utah Foreclosure Risk Index
Where financial pressure on Utah homeowners is building, county by county
 Published on October 7th, 2026, by John Carter | Founder, NestCash
Original NestCash research, free to read and cite.
Abstract
Utah is back on the list of states with the worst foreclosure rates. In the first half of 2026 the state recorded 2,292 foreclosure filings, one for every 534 housing units, the 10th-highest rate in the country (ATTOM Data Solutions). Filings were up 29 percent from the first half of 2025 and 89 percent from the first half of 2024, the fastest two-year rise of any state in the top ten. During the foreclosure crisis Utah had the fifth-highest rate in the nation in 2009, 2010, and 2011. Today’s rate is a small fraction of that one, and Utah homeowners hold record equity, so this is a rise from a low base, not a return to crisis.
We built a county-level Foreclosure Risk Index from four public datasets to see where the pressure sits. It is not on the Wasatch Front’s biggest markets. Four counties grade Elevated in every version of the index we tested: Iron County, home to Cedar City, which ranks first; Weber County, home to Ogden, which has the highest published mortgage delinquency rate in the state; Washington County, home to St. George; and Uintah County in the Uintah Basin. Salt Lake County, which holds more than a third of Utah’s homes, grades Lower even though it has the heaviest price cutting of any ranked county, and Davis County, the fastest-selling market we ranked, scores lowest of all.
We score each county from 0 to 100 by blending four public signals, each weighted by how directly it bears on a mortgaged homeowner: market softness (35 percent), mortgage cost burden (30 percent), 90-day mortgage delinquency (20 percent), and unemployment (15 percent). Each signal is min-max normalized within Utah, so the score ranks counties against one another in the state, not against a national or absolute standard. A county grades Elevated at 50 or above, Moderate from 44 to 49.9, and Lower below 44. One rule keeps the ranking honest: we rank the 12 counties with at least 12,000 housing units. Utah’s other 17 counties are rural, and some had as few as nine homes listed for sale in September 2026, too few to score a market reliably. They stay in the data but are not ranked. The 12 ranked counties hold 93 percent of the state’s homes. Because some of Utah’s results lean on inputs that need care, we tested the index five different ways and report which findings hold in all of them. The full weighting, the normalization, and the limits of the data are spelled out in the methodology section below.
Key findings
- Utah’s foreclosures are rising faster than any other top-ten state’s. Utah ranked 10th by foreclosure rate in the first half of 2026, with 2,292 filings, up 29 percent from a year earlier and 89 percent from two years earlier. The next-fastest top-ten state, Indiana, rose 55 percent over those two years. In August Utah ranked ninth, one filing for every 2,920 housing units (ATTOM Data Solutions).
- Four counties hold up in every test. Iron (67.6), Weber (62.2), Washington (57.3), and Uintah (54.8) grade Elevated in all five versions of the index we ran. Iron ranks first on the standard index, and Weber ranks first in three of the five versions.
- Ogden has the clearest delinquency signal in the state. Weber County’s rate of mortgages 90 or more days delinquent, 1.1 percent, is the highest of any Utah county with a published rate, and it is the only one above 1 percent.
- The biggest markets are not where the risk is. Salt Lake County grades Lower at 39.0, and Davis County is the lowest-scoring ranked county at 23.9, even though the two have the highest shares of listings with a price cut. More than half of Utah’s homes are in counties that grade Lower.
- This is not 2010. Utah’s foreclosure rate peaked at 3.44 percent of homes in 2010, at least among the years we could verify. At its first-half pace, the 2026 rate will be about 0.37 percent, roughly a ninth of that.
Methodology
Three limits to read first
We state these before the method because they shape how the Utah results should be read.
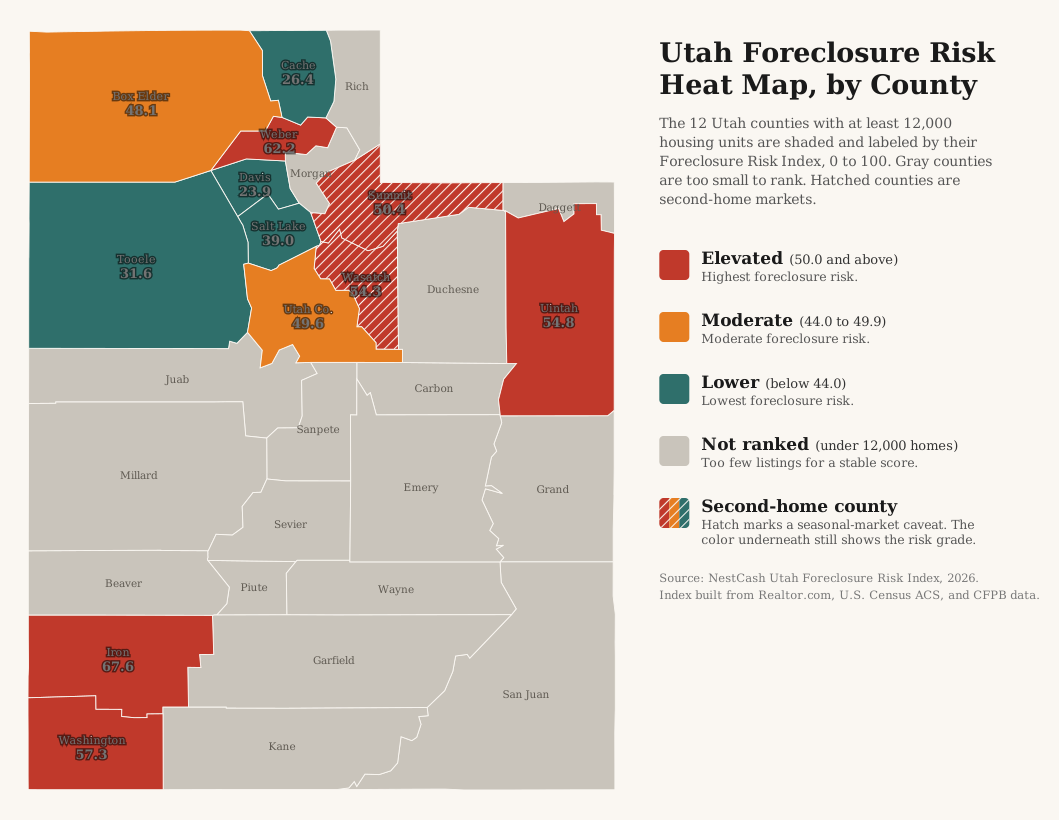
Second-home counties. Median days on market is half of the market-softness input, and in Utah’s resort counties it is inflated by slow-selling vacation and luxury homes, for reasons unrelated to household strain. To flag these counties by rule rather than judgment, we used the Census count of homes held for seasonal, recreational, or occasional use. Statewide, 3.7 percent of Utah’s homes fall in that category, high enough that the 5 percent cutoff we have used in most states would flag 19 of Utah’s 29 counties. So, as in our New York index, we instead flag counties at three times the statewide share, 11.0 percent. Two ranked counties clear that line: Summit County (34.7 percent, Park City) and Wasatch County (18.0 percent, Heber City and the Jordanelle area). Washington County, at 10.1 percent, is just below it and is not flagged. The two are hatched on the map and marked with a dagger in the chart and table, the treatment we gave the mountain resort counties in our Colorado index.
The flag matters. Summit and Wasatch grade Elevated on the standard index, but both fall to Lower when market softness is measured by price cuts alone, Wasatch from 54.3 to 36.8 and Summit from 50.4 to 35.5. They also have the lowest unemployment rates of the ranked counties. We do not read either county’s rank as evidence of local household distress.
Delinquency data for half of the ranked counties. The CFPB publishes a county’s 90-day delinquency rate only when the county has enough mortgages in its sample. In Utah, six of the 12 ranked counties qualify: Salt Lake, Utah, Davis, Weber, Washington, and Cache. The other six, including Iron, the top-ranked county, carry the statewide rate of 0.7 percent. Iron’s first-place score therefore rests on its slow market and high cost burden, not on a measured delinquency rate. Of the four counties that hold up in every test, Weber and Washington have published rates of their own.
Unemployment that has already moved. The Census unemployment figure is a five-year estimate covering 2020 through 2024, a window that includes the pandemic shutdowns. Uintah County’s five-year estimate, 6.0 percent, is the highest of the ranked counties, but its current rate over the latest 12 months is 3.9 percent. Uintah still grades Elevated when the current rate is used.
We kept the standard formula anyway. Changing the method state by state would break the comparability that makes the series useful, and disclosing where the result is fragile is more useful to readers than tuning it away.
Data and sources
We built the index entirely from public and openly licensed data, and we cite each source at the point of use. Market conditions come from Realtor.com Economic Research (county listing data through September 2026). Housing tenure, mortgage status, cost burden, seasonal homes, county housing counts, and unemployment come from the U.S. Census Bureau’s American Community Survey five-year estimates (2020 to 2024). Mortgage delinquency comes from the Consumer Financial Protection Bureau’s Mortgage Performance Trends (latest data December 2025). Current county unemployment for the sensitivity test comes from the Bureau of Labor Statistics’ Local Area Unemployment Statistics. Statewide filing counts, national ranks, and trends come from ATTOM Data Solutions’ published foreclosure market reports. Every dataset we used is free and publicly available.
Building the index
The Utah Foreclosure Risk Index uses the same formula as every state in this series, a weighted blend of four signals, each chosen because it precedes or predicts foreclosure among homeowners who carry a mortgage:
35%
The share of active listings with a price cut and the median days a home sits on the market. A soft market matters because a homeowner in trouble who cannot sell quickly has fewer ways to avoid foreclosure. See the note on second-home counties above.
30%
The share of owners with a mortgage who spend more than 30 percent of household income on housing. This is direct payment stress on the exact population that can be foreclosed on.
20%
The 90-day-or-more delinquency rate, the clearest early warning that foreclosures are coming. Published for six of Utah’s 12 ranked counties. See the note above.
15%
A secondary driver. We hold its weight down deliberately, because unemployment also captures renters and therefore dilutes a signal meant to describe homeowners.
We normalized each signal across the 12 ranked counties on a 0-to-1 scale, where 0 is the lowest value in that set and 1 is the highest, then applied the weights above and multiplied by 100. The result is a relative score: it ranks Utah counties against one another, not against a national or absolute standard. With only 12 counties in the comparison, half of them land in the Elevated tier, so a high grade in Utah means higher than the state’s other large counties, not high by the standards of Florida or Indiana. We graded each county by its score, Elevated for 50.0 or above, Moderate for 44.0 to 49.9, and Lower for anything below 44.0. Six counties land in the Elevated tier, two in Moderate, and four in Lower. The six Elevated counties hold 21.5 percent of the state’s homes, while the four Lower counties, led by Salt Lake, hold 52.5 percent.
To test how much the results depend on any one input, we scored the counties five ways: the standard index; the standard index with current Bureau of Labor Statistics unemployment, the 12 published months from August 2025 through August 2026, in place of the Census five-year estimate; the index with delinquency removed and its weight spread proportionally across the other three signals; the index with market softness measured by price cuts alone; and price cuts alone combined with current BLS unemployment. When we call a finding robust in this report, it holds in all five.
Other limitations
The index is relative. A Lower grade means lower measured risk than other large Utah counties, not low risk in absolute terms. It also measures leading pressure, not completed foreclosures or filings, so it will not match any single month’s filing counts. ATTOM named Sevier, Carbon, Sanpete, and Tooele as the Utah counties with the worst filing rates in August 2026. Sevier, Carbon, and Sanpete are below our 12,000-home floor and are not ranked, and Tooele grades Lower on the standard index. Filing counts in Utah may also understate distress. A Realtor.com analysis reported by the Deseret News found that Utah has the nation’s highest ratio of short sales to foreclosure sales, about 3.3 to 1, which suggests many owners in trouble sell before a foreclosure is completed. Counties that tie at the published one-decimal score would share a rank. None do in this edition.
Findings
The index
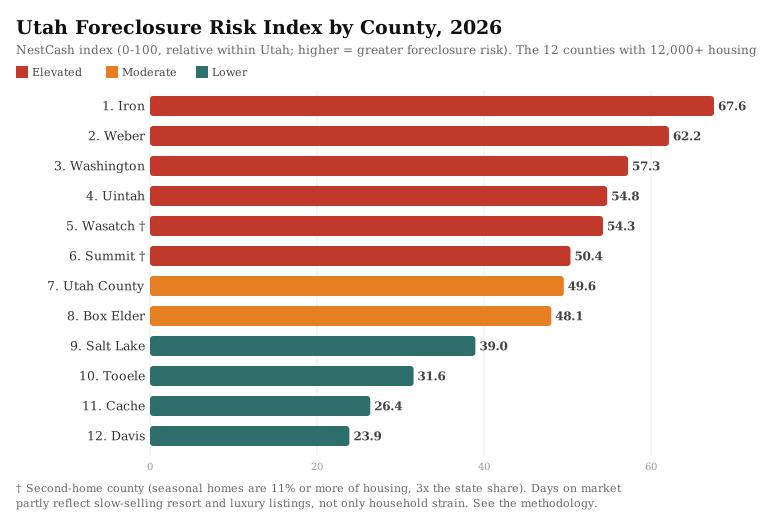
Ranked from most to least risk on the standard formula. Read the daggered second-home counties with the limits above in mind.
Southern Utah: Iron and Washington counties
Iron County, home to Cedar City and Southern Utah University, ranks first at 67.6, and it grades Elevated in every version of the index. Its typical home sat 90 days on the market in September 2026, tied for the slowest of the ranked counties, and its owners carry a 30.8 percent housing cost burden, tied for the second highest in the state. Its Census unemployment rate, 3.9 percent, is the second highest among the ranked counties. Iron does not have a published delinquency rate of its own, so its score rests on market and cost pressure, and on price cuts alone it falls to fifth, still Elevated.
Washington County, home to St. George, ranks third at 57.3 and stays Elevated in all five versions. Its owners carry the highest housing cost burden of the ranked counties, 31.0 percent, homes sat a median of 72 days on the market, and 22.2 percent of listings carried a price cut. Its delinquency rate, 0.6 percent, is a published county figure. Seasonal homes are 10.1 percent of its housing, just under our second-home flag. Readers should keep that in mind, but its result does not depend on days on market: it ranks fourth on price cuts alone.
Weber County: Ogden’s delinquency signal
Weber County, home to Ogden, ranks second at 62.2, and it ranks first in three of the five versions of the index, including both versions that use current unemployment. Its 1.1 percent rate of mortgages 90 or more days delinquent is the highest of the six Utah counties with published rates and the only one above 1 percent. Nearly a third of its listings, 31.9 percent, carried a price cut in September 2026, the fourth-highest share in the state. Its current unemployment rate over the latest 12 months, 3.8 percent, is also higher than its five-year estimate. With 100,568 homes, Weber is the fourth-largest county in Utah by housing, and of the four robust Elevated counties it has the most homes.
Uintah County and the Uintah Basin
Uintah County, home to Vernal, ranks fourth at 54.8 and grades Elevated in every version of the index. Its homes sat a median of 75 days on the market, the fourth-slowest of the ranked counties, and its five-year unemployment estimate, 6.0 percent, is the highest of the ranked counties. On current unemployment, 3.9 percent, Uintah is tied with Tooele County for the highest rate among the ranked counties and still grades Elevated. Like Iron, it has no published delinquency rate of its own.
Park City and the Heber Valley: high scores, weak evidence
Wasatch County (54.3) and Summit County (50.4) both grade Elevated on the standard index, on the slowest markets of the ranked counties, a median of 90 days on the market, and cost burdens near the top of the ranking. Both are second-home counties, and both fall to Lower when the index uses price cuts alone. Their unemployment rates, 2.0 and 1.8 percent on the five-year estimate, are the lowest of the ranked counties. We read their scores as a measure of slow-selling high-end inventory, and we would not describe either as a foreclosure hotspot.
The Wasatch Front
Utah County, home to Provo and Orem, grades Moderate at 49.6, just below the Elevated line. Its 0.8 percent delinquency rate is the second highest of the counties with published rates, and it rises to Elevated in three of the five versions of the index, including both that use current unemployment. Box Elder County, north of Ogden, also grades Moderate, at 48.1, and it rises to Elevated in four of the five versions.
The rest of the Wasatch Front grades Lower. Salt Lake County, with 449,662 homes, 36.8 percent of the state’s housing, scores 39.0. It has the heaviest price cutting of any ranked county, 34.2 percent of listings, but a delinquency rate of 0.5 percent, tied for the lowest published rate in the state, and a relatively fast market, a median of 58 days. Salt Lake is not a safe-ground finding, though: on price cuts alone it rises to 54.5, Elevated. Davis County, between Salt Lake and Ogden, is the lowest-scoring ranked county at 23.9. It has the second-highest price-cut share of the ranked counties, 34.0 percent, but the fastest market in the state, a median of 54 days, the same 0.5 percent delinquency rate, and one of the lowest cost burdens, 21.3 percent. Cache County (26.4), home to Logan, and Tooele County (31.6), which has the lowest cost burden of any ranked county at 20.1 percent, round out the Lower tier.
How today compares with the last crisis
Utah was one of the hardest-hit states in the foreclosure crisis. In 2009, 27,140 Utah properties received a foreclosure filing, 2.93 percent of the state’s housing against 2.21 percent nationally, the fifth-highest rate in the country and up 83 percent from 2008 (RealtyTrac). The rate rose again in 2010, to 3.44 percent, still fifth, and in 2011 Utah posted the nation’s fifth-highest rate for the third year running, 2.32 percent. Activity then fell fast. Utah’s foreclosure activity dropped 40 percent in 2012, and Utah’s annual rate does not appear in the year-end reports we could verify for 2012 through 2025, so the chart shows those years as a gap rather than estimates.
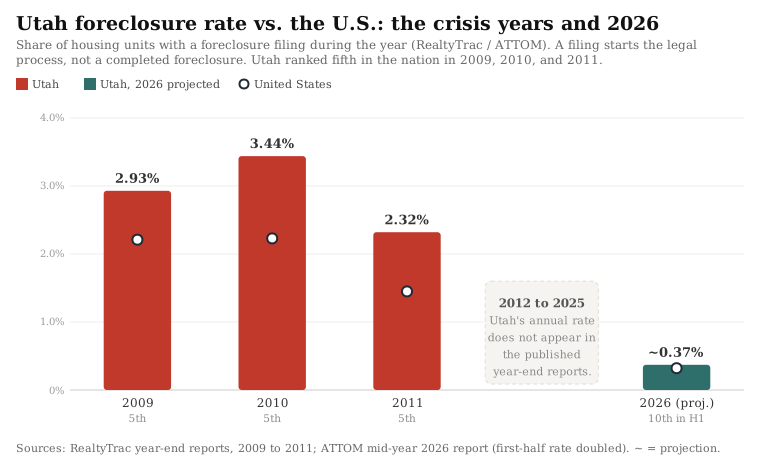
At its first-half pace, Utah is on track for a foreclosure rate of roughly 0.37 percent of homes in 2026, above the national pace of about 0.32 percent but about a ninth of its 2010 rate. A filing marks the start of the legal process, not a completed foreclosure, and the 2026 figure doubles the first-half rate, so it is an approximation. The state’s own housing researchers see the same thing from the other side. The Kem C. Gardner Policy Institute at the University of Utah reported in September 2026 that delinquencies and foreclosures “increased slightly but remained well below long-term averages,” and that average equity among Utah homes with a mortgage reached a record of about $304,570 in the first quarter of 2026. Homeowners with that much equity can usually sell rather than lose a home, which is one reason the risk in Utah is concentrated where markets are slow and costs are high.
If you are a Utah homeowner facing foreclosure
This report is a market analysis, not legal advice, but the data points to a few things worth knowing. A Utah home financed with a trust deed can be foreclosed outside of court. The trustee must first record a notice of default with the county recorder, and at least three months must pass before it can give notice of a sale (Utah Code 57-1-24). The sale notice must be published at least once a week for three consecutive weeks and posted on the property at least 20 days before the sale (Utah Code 57-1-25). Your lender can also choose to foreclose through the courts.
You can stop a non-judicial foreclosure by paying the full amount then due, not counting principal that would not be due without the default, within three months of the notice of default being recorded, and your loan is then reinstated as if the default had not happened (Utah Code 57-1-31). After a trustee’s sale there is no right to buy the home back (Utah Code 57-1-28). If the sale does not cover the loan, the lender has three months to sue for the difference, and a court cannot award more than the debt minus the home’s fair market value (Utah Code 57-1-32).
Free help is available. The Community Development Corporation of Utah has HUD-certified housing counselors who help with foreclosure options and lender negotiations, at 801-994-7222 (CDCU). Utah Legal Services provides free civil legal help statewide at (801) 328-8891, with offices in Provo, Ogden, and St. George (Utah Legal Services). You can also find a counselor through the CFPB’s housing counselor search. Be wary of anyone who charges up-front fees to stop a foreclosure or asks you to sign over the deed to your home.
The full data
All 12 ranked counties, from highest to lowest Foreclosure Risk Index. An asterisk on the delinquency rate marks a county where the Utah statewide rate was substituted because its own rate is not separately reported. A dagger marks a second-home county, where seasonal homes are 11 percent or more of housing and days on market partly reflect seasonal and luxury listings. Unemployment is the five-year Census estimate used in the index. See the limits at the start of the methodology.
| Rank | County | FRI | Grade | Price cuts | Median DOM | Cost burden | 90+ delinq | Unemployment |
|---|---|---|---|---|---|---|---|---|
| 1 | Iron | 67.6 | Elevated | 18.9% | 90 | 30.8% | 0.7*% | 3.9% |
| 2 | Weber | 62.2 | Elevated | 31.9% | 62 | 26.7% | 1.1% | 3.0% |
| 3 | Washington | 57.3 | Elevated | 22.2% | 72 | 31.0% | 0.6% | 3.6% |
| 4 | Uintah | 54.8 | Elevated | 18.5% | 75 | 26.2% | 0.7*% | 6.0% |
| 5 | Wasatch † | 54.3 | Elevated | 10.0% | 90 | 30.8% | 0.7*% | 2.0% |
| 6 | Summit † | 50.4 | Elevated | 13.6% | 90 | 28.7% | 0.7*% | 1.8% |
| 7 | Utah County | 49.6 | Moderate | 28.0% | 64 | 25.4% | 0.8% | 3.8% |
| 8 | Box Elder | 48.1 | Moderate | 32.3% | 64 | 25.7% | 0.7*% | 3.2% |
| 9 | Salt Lake | 39.0 | Lower | 34.2% | 58 | 24.6% | 0.5% | 3.8% |
| 10 | Tooele | 31.6 | Lower | 27.5% | 66 | 20.1% | 0.7*% | 3.6% |
| 11 | Cache | 26.4 | Lower | 18.7% | 64 | 23.4% | 0.6% | 2.6% |
| 12 | Davis | 23.9 | Lower | 34.0% | 54 | 21.3% | 0.5% | 2.7% |
Seventeen counties are not ranked because they fall below the 12,000-housing-unit floor: Beaver, Carbon, Daggett, Duchesne, Emery, Garfield, Grand, Juab, Kane, Millard, Morgan, Piute, Rich, San Juan, Sanpete, Sevier, and Wayne.
What we will watch
We plan to update this index quarterly, beginning with the first quarter of 2027. Three things will tell us where Utah goes from here: whether Weber County’s delinquency rate, already the highest published rate in the state, keeps rising; whether Salt Lake County’s heavy price cutting turns into the slower sales and missed payments that would move it up the index; and whether the rural central Utah counties on ATTOM’s August list of worst filing rates, Sevier, Carbon, and Sanpete, stay there. For neighboring markets, see our Nevada and Colorado indexes.
Sources and data
- Foreclosure activity and trend. ATTOM Data Solutions, 2026 Mid-Year U.S. Foreclosure Market Report and U.S. Foreclosure Rates by State, August 2026 (published September 18, 2026). Used for statewide filing counts, national ranks, the one-year and two-year changes, and the counties with the worst August filing rates.
- Housing market softness. Realtor.com Economic Research, county inventory core metrics through September 2026. Used for the price-cut share, median days on market, and active listing counts.
- Housing, mortgage status, cost burden, seasonal homes, and unemployment. U.S. Census Bureau, American Community Survey five-year estimates, 2020 to 2024. Used for county housing counts, the mortgaged-owner universe, housing cost burden, the seasonal-home share behind the second-home flag, and the unemployment rate in the index.
- Current unemployment. U.S. Bureau of Labor Statistics, Local Area Unemployment Statistics, county unemployment rates, the 12 published months from August 2025 through August 2026 (BLS published no October 2025 figures). Used only for the sensitivity test, not in the standard index.
- Mortgage delinquency. CFPB Mortgage Performance Trends, data through December 2025. Used for the 90-or-more day delinquency rates.
- Historical foreclosure rates. RealtyTrac, 2009 Year-End Foreclosure Market Report (via the Financial Crisis Inquiry Commission archive), and the RealtyTrac year-end U.S. foreclosure market reports for 2010 through 2012. Used for Utah’s 2009 to 2011 foreclosure rates and ranks and the 2012 decline. The 2010 rank is taken from the order of RealtyTrac’s published top-ten list, and 2026 is a full-year projection from the first-half rate.
- Equity and housing context. Kem C. Gardner Policy Institute, University of Utah, as reported by @TheU, September 2026. Realtor.com short-sale analysis as reported by the Deseret News, July 17, 2026.
- Foreclosure process. Utah Code Title 57, Chapter 1, sections 57-1-23, 57-1-24, 57-1-25, 57-1-28, 57-1-31, and 57-1-32. Used for the notice, sale, cure, redemption, and deficiency rules. Help lines from CDCU and Utah Legal Services.
About NestCash
NestCash buys houses for cash in twelve states and publishes original housing and distressed-property research across U.S. markets. Our original housing research helps homeowners, buyers, and investors understand local market conditions. This report may be cited and its charts embedded with attribution to NestCash.

John is the Founder of NestCash and a leading voice in real estate investing and housing market strategy. With experience across 12 states, he helps buyers, sellers, and investors make smarter decisions using real-world insight and market data.