
The 2026 Washington Foreclosure
Risk Index
The coast and the recreation counties lead a quiet state
 Published on October 30th, 2026, by John Carter | Founder, NestCash
Original NestCash research, free to read and cite.
Abstract
Washington is one of the quieter foreclosure markets in the country. In the first half of 2026, 2,482 Washington properties had a foreclosure filing, one for every 1,332 housing units, the 40th-highest rate of any state, against a national rate of one in 632. That count was 0.4 percent higher than in the first half of 2025, while filings nationally rose 21 percent (ATTOM Data Solutions). The calm follows a jump: in the first half of 2025, Washington’s filings had risen 40 percent from a year earlier, so over two years they are up 41 percent, against 28 percent nationally. At the end of 2025, 0.6 percent of Washington mortgages were 90 or more days delinquent, against 0.9 percent nationally (Consumer Financial Protection Bureau).
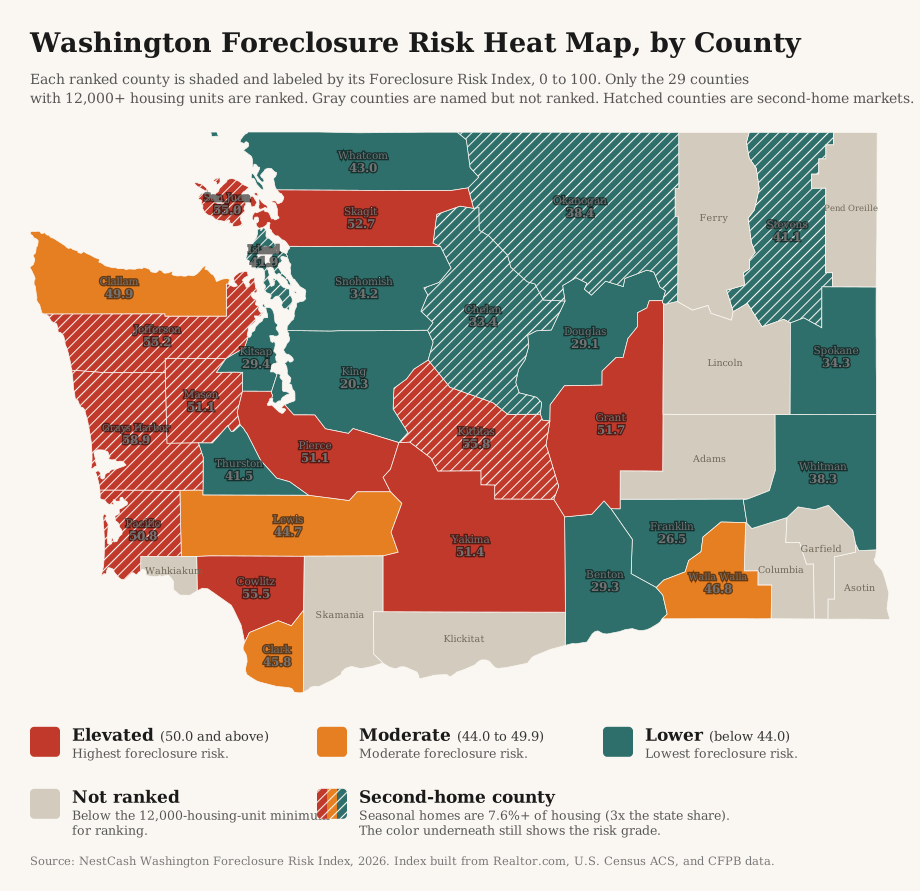
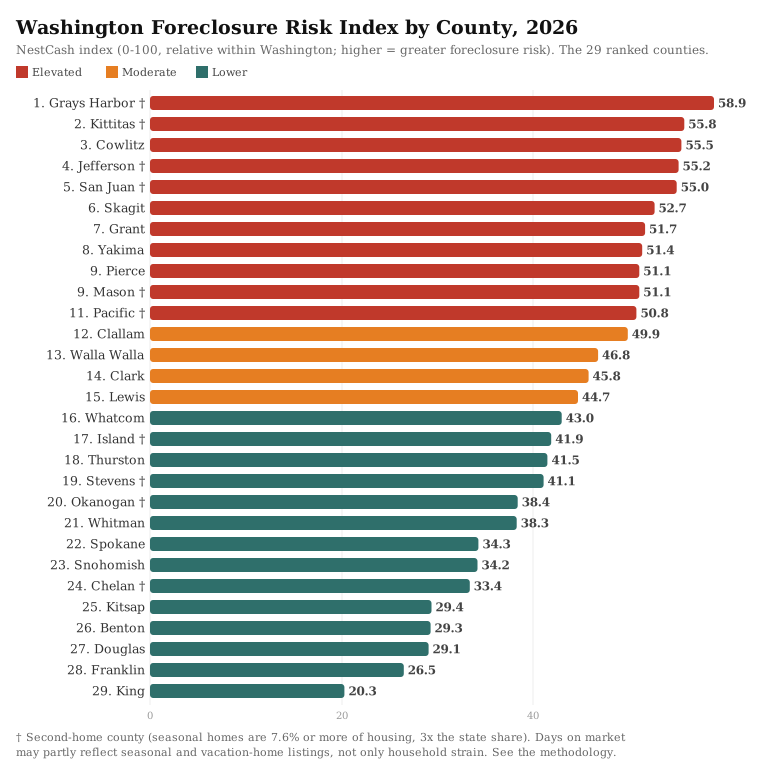
We built a county-level Foreclosure Risk Index from four public datasets to see where the pressure sits inside the state. It is not in the Seattle metro. Grays Harbor County, home to Aberdeen and Hoquiam on the Pacific coast, ranks first at 58.9. Kittitas County, home to Ellensburg, ranks second at 55.8, Cowlitz County, home to Longview and Kelso, third at 55.5, Jefferson County, home to Port Townsend, fourth at 55.2, and San Juan County fifth at 55.0. Four of those five are second-home markets we flag throughout the report. Three counties grade Elevated in every version of the index we tested: Grays Harbor, Cowlitz, and Jefferson. King County, home to Seattle and nearly a third of the state’s homes, ranks last of the 29 ranked counties at 20.3, with the lowest published mortgage delinquency rate of any Washington county.
We score each county from 0 to 100 by blending four public signals, each weighted by how directly it bears on a mortgaged homeowner: market softness (35 percent), mortgage cost burden (30 percent), 90-day mortgage delinquency (20 percent), and unemployment (15 percent). Each signal is min-max normalized within Washington, so the score ranks counties against one another in the state, not against a national or absolute standard. A county grades Elevated at 50 or above, Moderate from 44 to 49.9, and Lower below 44. We rank counties with at least 12,000 housing units, and 29 of Washington’s 39 counties clear that floor, holding 98.3 percent of the state’s homes. Ten ranked counties are second-home markets, and we flag them. We tested the index five different ways and report which findings hold in all of them. The full weighting, the normalization, and the limits of the data are spelled out in the methodology section below.
Key findings
- Washington’s filings were flat while the nation’s rose. The 2,482 properties with a filing in the first half of 2026 were 0.4 percent more than a year earlier, against a 21 percent national increase, and the state’s rate ranks 40th of 50. That follows a 40 percent rise in the first half of 2025, so filings are up 41 percent over two years (ATTOM Data Solutions).
- The pressure is on the coast and in the recreation counties, not in Seattle. Grays Harbor, Kittitas, Cowlitz, Jefferson, and San Juan counties fill the top five. Four of them are second-home markets. King County ranks last, and Snohomish, Kitsap, and Spokane counties all grade Lower.
- Three counties grade Elevated in every version. Grays Harbor, Cowlitz, and Jefferson stay Elevated in all five versions of the index. Eight counties grade Lower in every version: Okanogan, Whitman, Chelan, Kitsap, Benton, Douglas, Franklin, and King.
- Published delinquency is highest where the index says it is. The CFPB publishes a 90-day delinquency rate for 11 Washington counties. The highest, 1.1 percent in Skagit and Yakima counties, is above the national 0.9 percent, and both counties grade Elevated. The lowest, 0.3 percent in King County, is a third of the national rate.
- ATTOM’s own county list points the same way. For August 2026, ATTOM listed Grays Harbor, Mason, Lincoln, and Pierce counties in its Washington entry. Grays Harbor ranks first in our index, Pierce and Mason tie for ninth, and Lincoln, too small to be ranked, scores above every ranked county but Grays Harbor.
- Repossessions caught up even as filings leveled off. Lenders repossessed 224 Washington properties in the first quarter of 2026, up from 104 a year earlier, one of the five largest increases among states with at least 100 repossessions (ATTOM Data Solutions).
You're on the list.
We'll email you when the next report is out. One optional question so we can send the right research:
Methodology
Three limits to read first
We state these before the method because they shape how the Washington results should be read.
Delinquency data for 11 of 29 ranked counties. The CFPB publishes a county’s 90-day delinquency rate only when the county has enough mortgages in its sample. In Washington, 11 ranked counties qualify: Skagit (1.1 percent), Yakima (1.1), Pierce (0.9), Whatcom (0.8), Benton (0.7), Spokane (0.7), Clark (0.6), Kitsap (0.6), Thurston (0.6), Snohomish (0.5), and King (0.3). The other 18, including the top five, carry the statewide rate of 0.6 percent. When we remove delinquency from the index, Skagit falls from sixth to 17th and Yakima from eighth to 18th, both grading Lower, and Pierce falls from ninth to 13th and grades Moderate. Every delinquency claim in this report is about published rates only.
Ten ranked second-home counties. Median days on market is half of the market-softness input, and in second-home markets it is likely inflated by vacation homes that sit longer on the market. Statewide, 2.5 percent of Washington homes are held for seasonal, recreational, or occasional use. Our usual cutoff, 5 percent, would flag 19 of Washington’s 39 counties, so, as in New York and Idaho, we flag a county when its share is at least three times the statewide share, 7.6 percent. Fourteen counties clear it, ten of them ranked: San Juan (32.3 percent), Pacific (27.4), Mason (18.4), Chelan (14.2), Kittitas (13.3), Okanogan (13.2), Grays Harbor (11.3), Island (10.1), Jefferson (9.5), and Stevens (9.5). Grant County, at 6.6 percent, is the next ranked county below the line. Four of the top five ranked counties carry the flag, so the top of this index should be read as a coast-and-mountain story shaped partly by vacation housing, not only by household strain. The one exception is Cowlitz County, where 0.9 percent of homes are seasonal.
Unemployment estimates differ. The index uses the Census five-year unemployment estimate, which covers 2020 to 2024 and includes the pandemic shutdowns. In Washington’s college counties it runs well above the current rate from the Bureau of Labor Statistics: Whitman County, home to Pullman and Washington State University, 7.0 percent against 3.9 percent, Kittitas County, home to Ellensburg and Central Washington University, 6.3 against 4.8, and Walla Walla County 6.2 against 4.2. In Jefferson County it is 6.6 against 5.0. With current unemployment, Kittitas falls from second to eighth and Walla Walla from 13th to 19th and grades Lower.
We kept the standard formula anyway. Changing the method state by state would break the comparability that makes the series useful, and disclosing where the result is fragile is more useful to readers than tuning it away.
Data and sources
We built the index entirely from public and openly licensed data, and we cite each source at the point of use. Market conditions come from Realtor.com Economic Research (county listing data through September 2026). Housing tenure, mortgage status, cost burden, seasonal homes, county housing counts, and unemployment come from the U.S. Census Bureau’s American Community Survey five-year estimates (2020 to 2024). Mortgage delinquency comes from the Consumer Financial Protection Bureau’s Mortgage Performance Trends (latest data December 2025). Current county unemployment for the sensitivity test comes from the Bureau of Labor Statistics’ Local Area Unemployment Statistics. Statewide filing counts, national ranks, and trends come from ATTOM Data Solutions’ published foreclosure market reports. Mediation and hotline figures come from the Washington State Department of Commerce’s Foreclosure Fairness Program reports. Every dataset we used is free and publicly available.
Building the index
The Washington Foreclosure Risk Index uses the same formula as every state in this series, a weighted blend of four signals, each chosen because it precedes or predicts foreclosure among homeowners who carry a mortgage:
35%
The share of active listings with a price cut and the median days a home sits on the market. A soft market matters because a homeowner in trouble who cannot sell quickly has fewer ways to avoid foreclosure. See the note on second-home counties above.
30%
The share of owners with a mortgage who spend 30 percent or more of household income on housing. This is direct payment stress on the exact population that can be foreclosed on.
20%
The 90-day-or-more delinquency rate, the clearest early warning that foreclosures are coming. Published for 11 of the 29 ranked counties. See the note above.
15%
A secondary driver. We hold its weight down deliberately, because unemployment also captures renters and therefore dilutes a signal meant to describe homeowners.
We ranked the 29 counties with at least 12,000 housing units. Smaller counties have few listings in a given month, which makes their market data noisy, and the 29 ranked counties hold 3,248,757 of Washington’s 3,306,620 homes. We normalized each signal across the ranked counties on a 0-to-1 scale, where 0 is the lowest value in that set and 1 is the highest, then applied the weights above and multiplied by 100. The result is a relative score: it ranks Washington counties against one another, not against a national or absolute standard. We then graded each county by its score, Elevated for 50.0 or above, Moderate for 44.0 to 49.9, and Lower for anything below 44.0. Eleven counties land in the Elevated tier, four in Moderate, and fourteen in Lower. The 11 Elevated counties hold 22.7 percent of the state’s homes.
To test how much the results depend on any one input, we scored the counties five ways. The first is the standard index. The second swaps in current Bureau of Labor Statistics unemployment, the 12 published months from September 2025 through September 2026, for the Census five-year estimate. The third removes delinquency and spreads its weight proportionally across the other three signals. The fourth measures market softness by price cuts alone, and the fifth combines price cuts alone with current BLS unemployment. When we call a finding robust in this report, it holds in all five.
Other limitations
The index is relative. A grade describes a county’s position among Washington’s ranked counties, not its risk in absolute terms. King County’s score of 20.3 means it sits at or near the low end of the ranked counties on most inputs, not that its homeowners face no risk. The index also measures leading pressure, not completed foreclosures or filings, so it will not match any single month’s filing counts. The 10 counties below the housing floor are not ranked, and the index says nothing conclusive about them. Two of them, Wahkiakum and Ferry, would score above Grays Harbor on the same formula, so every “highest” in this report is a claim about ranked counties. Counties that tie at the published one-decimal score share a rank, as Pierce and Mason do at 51.1.
Findings
The index
Ranked from most to least risk on the standard formula. Read the daggered second-home counties with the limits above in mind.
Grays Harbor, the Pacific coast, and the Olympic Peninsula
Grays Harbor County, home to Aberdeen and Hoquiam, scores 58.9 and ranks first. Its lead does not rest on one extreme input. It sits at or above the middle of the ranked counties on all four: 22.6 percent of its listings carry a price cut, its listings sit on the market a median of 93 days, 33.8 percent of its homeowners with a mortgage spend 30 percent or more of their income on housing, and its five-year unemployment estimate, 7.0 percent, is the second-highest of any ranked county, tied with Whitman. Its current rate is 5.7 percent. Grays Harbor grades Elevated in all five versions of the index, ranking first in two of them, second with current unemployment, and ninth in the two versions that measure market softness by price cuts alone. It is also a second-home market, with 11.3 percent of its homes held for seasonal use. ATTOM listed it in its Washington entry for August 2026.
Pacific County, to the south, ranks 11th at 50.8 and is the state’s clearest vacation-home market after San Juan: 27.4 percent of its homes are seasonal. The chair of the county planning commission said in 2025 that second homes made up 35 to 40 percent of the county’s housing before the pandemic and about 29 percent after it (Chinook Observer). Its listings sit on the market a median of 94 days, and its current unemployment rate, 6.3 percent, is the highest of any ranked county. Pacific ranks first on the version of the index that uses current unemployment, and it grades Lower on the version that measures softness by price cuts alone. Its score should be read with both facts in mind.
On the Olympic Peninsula, Jefferson County, home to Port Townsend, ranks fourth at 55.2 and grades Elevated in all five versions. Of its homeowners with a mortgage, 39.1 percent carry a high cost burden, the second-highest share of any ranked county, and 9.5 percent of its homes are seasonal. Clallam County, home to Port Angeles and Sequim, ranks 12th at 49.9 and grades Moderate, a tenth of a point below Elevated. Its cost burden, 36.7 percent, is the third-highest of any ranked county, and it grades Elevated in the four other versions of the index. Mason County, home to Shelton and the Hood Canal shoreline, ties Pierce for ninth at 51.1. It is a second-home market, with 18.4 percent of its homes seasonal, and ATTOM listed it for August 2026.
Longview, Tacoma, and the I-5 corridor south of Seattle
Cowlitz County, home to Longview and Kelso, ranks third at 55.5 and is the one county in the top five that is not a second-home market. Its signal is the sales market: 31.7 percent of its active listings carry a price cut, the highest share of any ranked county. On the two versions of the index that measure market softness by price cuts alone, Cowlitz ranks first and second. It grades Elevated in all five versions.
Pierce County, home to Tacoma and the state’s second-largest county by number of homes at 369,709, ranks ninth at 51.1, tied with Mason, and is the only county with more than 100,000 homes in the Elevated tier. Its published 90-day delinquency rate, 0.9 percent, matches the national rate and is the third-highest published rate in the state. Its price-cut share, 29.2 percent, is the third-highest of any ranked county. Pierce ranks first or second on the two price-cut versions of the index and falls to 13th, grading Moderate, when delinquency is removed. In June 2026, the Puget Sound Business Journal reported that Pierce County had the highest foreclosure rate among Puget Sound region counties, citing ATTOM data. ATTOM listed Pierce in its Washington entry for August 2026.
Thurston County, home to Olympia, ranks 18th at 41.5 and grades Lower, but 28.1 percent of its listings carry a price cut, the fourth-highest share, and it grades Elevated when softness is measured by price cuts alone. Lewis County, home to Centralia and Chehalis, ranks 15th at 44.7, the lowest Moderate score. Clark County, home to Vancouver and the Portland suburbs, ranks 14th at 45.8 and grades Moderate. Its price-cut share, 31.1 percent, is the second-highest of any ranked county, and it grades Elevated, ranking fourth, on both price-cut versions. Its published delinquency rate is 0.6 percent.
Seattle, the Eastside, and the north Sound
King County, home to Seattle, Bellevue, and 1,003,284 homes, ranks last of the 29 ranked counties at 20.3 and grades Lower in every version of the index. Its published 90-day delinquency rate, 0.3 percent, is the lowest of any Washington county with a published rate and a third of the national rate. Its listings sit on the market a median of 50 days, a shorter time than in any ranked county but Spokane. Its labor market has softened: King County’s unemployment rate was about 4.9 percent in June 2026, up from 4.7 percent in May, according to state Employment Security Department data, and Amazon, Microsoft, Meta, and Expedia announced hundreds of local job cuts in the months before (KING 5). That shows up in our current-unemployment version, where King’s rate of 5.0 percent is slightly above its five-year estimate, but King still ranks last on that version. In the Seattle-Tacoma-Bellevue metro area, foreclosures made up 1.4 percent of home listings as of June 2026 (Realtor.com).
Snohomish County, home to Everett, ranks 23rd at 34.2 and grades Lower. Its published delinquency rate, 0.5 percent, is the second-lowest published rate in the state. Its price-cut share, 27.9 percent, is the fifth-highest of any ranked county, and on the version that combines price cuts with current unemployment it rises to tenth and grades Elevated. Kitsap County, home to Bremerton, ranks 25th at 29.4 and grades Lower in every version. Island County, home to Oak Harbor and Whidbey Island, ranks 17th and is a second-home market at 10.1 percent.
North of Everett, Skagit County, home to Mount Vernon and Anacortes, ranks sixth at 52.7. Its published 90-day delinquency rate, 1.1 percent, is the highest published rate in the state, tied with Yakima, and above the national 0.9 percent. That rate carries much of its score: with delinquency removed, Skagit falls to 17th and grades Lower. Whatcom County, home to Bellingham, ranks 16th at 43.0, a point below Moderate, with a published delinquency rate of 0.8 percent and the seventh-highest cost burden of any ranked county, 35.2 percent.
San Juan County ranks fifth at 55.0 and is the state’s purest second-home market: 32.3 percent of its homes are held for seasonal use. According to a draft of the county’s housing element, 81 percent of its vacant homes were for seasonal, recreational, or occasional use in the 2015 American Community Survey, and a 2019 review by an Orcas Island planning committee found that more than half of new structures were being built as second homes or vacation rentals (Salish Current). The county’s score follows from that. Its listings sit on the market a median of 108 days, the longest of any ranked county, and 43.7 percent of its homeowners with a mortgage carry a high cost burden, the highest share of any ranked county. But only 14.5 percent of its listings carry a price cut, the lowest share of any ranked county, and its unemployment is among the lowest in the state. On the two versions of the index that measure softness by price cuts alone, San Juan falls to 21st and 22nd and grades Lower. We report its rank, and we would not build a story on it.
Ellensburg, Yakima, and Central Washington
Kittitas County, home to Ellensburg and Central Washington University, ranks second at 55.8. Its listings sit on the market a median of 93 days, 35.7 percent of its homeowners with a mortgage carry a high cost burden, the fifth-highest share of any ranked county, and 13.3 percent of its homes are seasonal. Its five-year unemployment estimate, 6.3 percent, runs well above its current rate of 4.8 percent, and with current unemployment Kittitas falls to eighth. It grades Elevated in three versions, Moderate when softness is measured by price cuts alone, and Lower when price cuts are combined with current unemployment.
Yakima County ranks eighth at 51.4. Its published 90-day delinquency rate, 1.1 percent, ties Skagit for the highest published rate in the state, and its five-year unemployment estimate, 7.3 percent, is the highest of any ranked county. Its current rate is 5.9 percent, the third-highest of any ranked county. Yakima grades Elevated in three versions, Moderate with current unemployment, and Lower when delinquency is removed. Grant County, home to Moses Lake, ranks seventh at 51.7. Its current unemployment rate, 6.2 percent, is the second-highest of any ranked county, and its listings sit on the market a median of 91 days. Grant grades Elevated in three versions and Moderate on the two price-cut versions.
Chelan County, home to Wenatchee and Leavenworth, ranks 24th at 33.4 and grades Lower in every version, despite the second-longest median time on market of any ranked county, 102 days. It has the lowest five-year unemployment estimate of any ranked county, 3.7 percent, tied with San Juan, and the third-lowest cost burden. It is a second-home market at 14.2 percent. Douglas County, across the Columbia River, ranks 27th and also grades Lower in every version. Okanogan County, with 101 days on market and 13.2 percent of homes seasonal, ranks 20th and grades Lower in every version.
Spokane, the Tri-Cities, and the east
Spokane County ranks 22nd at 34.3 and grades Lower. Its listings sit on the market a median of 49 days, the shortest time of any ranked county, and its published delinquency rate is 0.7 percent. In the Spokane metro area, foreclosures made up 2.0 percent of home listings as of June 2026, a higher share than in the Seattle metro (Realtor.com). Spokane grades Moderate on the version that measures softness by price cuts alone.
Benton and Franklin counties, home to the Tri-Cities, rank 26th and 28th and grade Lower in every version. Benton has the lowest cost burden of any ranked county, 22.0 percent of homeowners with a mortgage, and a published delinquency rate of 0.7 percent. Walla Walla County ranks 13th at 46.8 and grades Moderate, but its five-year unemployment estimate, 6.2 percent, is far above its current rate of 4.2, and with current unemployment it falls to 19th and grades Lower. Whitman County, home to Pullman, has the same pattern, 7.0 percent against 3.9, and grades Lower in every version. Stevens County, north of Spokane, ranks 19th, with 94 days on market and 9.5 percent of homes seasonal.
How today compares with the last crisis
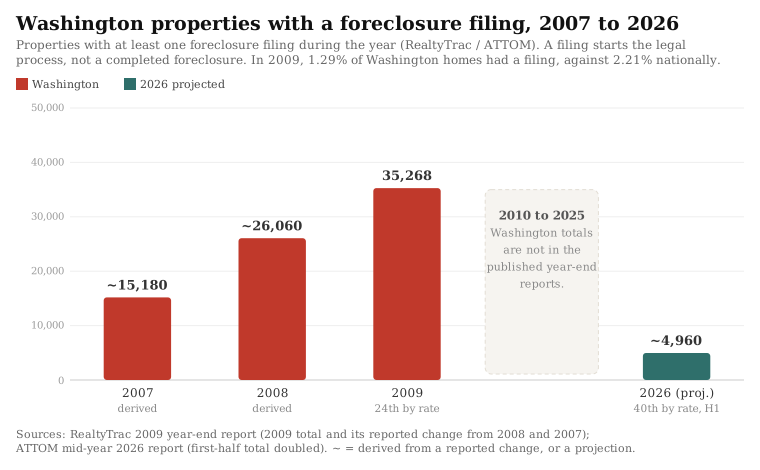
In 2009, 35,268 Washington properties had a foreclosure filing, 1.29 percent of the state’s housing units, against 2.21 percent nationally. That rate ranked Washington 24th among the states (RealtyTrac). Washington’s foreclosure wave also ran late. In 2013, when foreclosure activity fell nationally, Washington was one of only 10 states where it rose, by 13 percent from 2012, and one of 12 where bank repossessions rose, by 30 percent (RealtyTrac). By 2018, Washington’s foreclosure starts had fallen 24 percent in a year, one of the five largest declines of any state (ATTOM Data Solutions). The published year-end reports we hold do not give Washington’s totals for 2010 through 2025, so the chart shows those years as a gap rather than estimating them. At its first-half pace, Washington is on track for about 4,960 properties with a filing in 2026, about 0.15 percent of its housing units, against about 0.32 percent nationally. That is about a seventh of the 2009 count.
The state’s own mediation program tells the same story from the inside. Washington’s Foreclosure Fairness Program, created in 2011, received 13,413 mediation referrals through state fiscal year 2025 (Washington State Department of Commerce). Referrals fell to 104 in fiscal year 2021 and 238 in 2022, when federal pandemic protections held foreclosures down, then rose to 504 in fiscal year 2023 before easing to 399 in 2024 and 336 in 2025. The state’s Homeownership Hotline took 17,297 calls in fiscal year 2025.
How Washington compares with its neighbors
In the first half of 2026, Washington’s foreclosure rate was one in 1,332 housing units (ATTOM Data Solutions). That was lower than in every neighboring state we cover: Idaho, where Bonner County ranks first in our county index (one in 820) and Oregon, where our county index puts Lincoln County first (one in 1,170).
If you are a Washington homeowner facing foreclosure
This report is a market analysis, not legal advice, but the data points to a few things worth knowing. Washington is a non-judicial foreclosure state: a home financed with a deed of trust can be sold by a trustee without a court case (Washington State Department of Commerce). For a home of up to four units financed with a deed of trust, the process has to start with contact. A trustee or lender may not issue a notice of default until 30 days after the required contact attempts if the homeowner does not respond, and if the homeowner does respond, not until 90 days after the initial contact, a window the law sets aside for the two sides to try to reach a resolution such as a loan modification, a short sale, or a deed in lieu of foreclosure (RCW 61.24.031). The notice of trustee’s sale must then be recorded at least 90 days before the sale, or at least 120 days before it when that letter is required (RCW 61.24.040). Up to the eleventh day before the sale, the homeowner can stop it by curing the default set out in the notice, and the deed of trust is reinstated as though no acceleration had taken place (RCW 61.24.090).
Washington also has a state mediation program under the 2011 Foreclosure Fairness Act. A homeowner who has received a notice of default can be referred to mediation with the lender, but only by a housing counselor or an attorney, not on their own, and the referral must reach the Department of Commerce no later than 90 days before the sale date in the notice of trustee’s sale. The homeowner and the lender each pay half of the mediation fee (Department of Commerce). A 2025 law, Senate Bill 5686, funds the program with an $80 foreclosure prevention fee on each new residential mortgage loan at closing, other than reverse mortgages to seniors over 61, alongside the existing $250 fee lenders pay when they issue a notice of default, and from January 1, 2026, extends mediation to condominium and homeowner-association unit owners who are behind on their assessments (Northwest Justice Project).
Help is available. Washington homeowners can reach a free housing counselor at any time at 1-877-894-HOME (4663), and low- and moderate-income homeowners can contact the statewide civil legal aid program at 1-800-606-4819 or nwjustice.org/get-legal-help (Department of Commerce). The Foreclosure Fairness Program itself is at 360-725-3040. A HUD-approved housing counselor can also review your options: call (800) 569-4287 to find one near you (HUD).
The full data
The 29 ranked counties, from highest to lowest Foreclosure Risk Index. An asterisk on the delinquency rate marks a county where the Washington statewide rate was substituted because its own rate is not separately reported. A dagger marks a second-home county, where seasonal homes are at least three times the statewide share of housing, 7.6 percent. Unemployment is the five-year Census estimate used in the index. Counties that tie at the published score share a rank.
| Rank | County | FRI | Grade | Price cuts | Median DOM | Cost burden | 90+ delinq | Unemployment |
|---|---|---|---|---|---|---|---|---|
| 1 | Grays Harbor † | 58.9 | Elevated | 22.6% | 93 | 33.8% | 0.6*% | 7.0% |
| 2 | Kittitas † | 55.8 | Elevated | 19.9% | 93 | 35.7% | 0.6*% | 6.3% |
| 3 | Cowlitz | 55.5 | Elevated | 31.7% | 66 | 33.8% | 0.6*% | 5.9% |
| 4 | Jefferson † | 55.2 | Elevated | 21.0% | 67 | 39.1% | 0.6*% | 6.6% |
| 5 | San Juan † | 55.0 | Elevated | 14.5% | 108 | 43.7% | 0.6*% | 3.7% |
| 6 | Skagit | 52.7 | Elevated | 24.1% | 59 | 32.8% | 1.1% | 4.9% |
| 7 | Grant | 51.7 | Elevated | 21.7% | 91 | 31.2% | 0.6*% | 6.5% |
| 8 | Yakima | 51.4 | Elevated | 20.9% | 58 | 27.2% | 1.1% | 7.3% |
| 9 | Pierce | 51.1 | Elevated | 29.2% | 55 | 31.5% | 0.9% | 5.2% |
| 9 | Mason † | 51.1 | Elevated | 25.0% | 72 | 32.1% | 0.6*% | 6.6% |
| 11 | Pacific † | 50.8 | Elevated | 18.8% | 94 | 36.0% | 0.6*% | 5.2% |
| 12 | Clallam | 49.9 | Moderate | 25.2% | 67 | 36.7% | 0.6*% | 5.1% |
| 13 | Walla Walla | 46.8 | Moderate | 24.6% | 81 | 28.6% | 0.6*% | 6.2% |
| 14 | Clark | 45.8 | Moderate | 31.1% | 66 | 29.0% | 0.6% | 5.3% |
| 15 | Lewis | 44.7 | Moderate | 25.3% | 71 | 31.4% | 0.6*% | 5.3% |
| 16 | Whatcom | 43.0 | Lower | 19.7% | 57 | 35.2% | 0.8% | 4.8% |
| 17 | Island † | 41.9 | Lower | 21.4% | 71 | 35.3% | 0.6*% | 4.3% |
| 18 | Thurston | 41.5 | Lower | 28.1% | 60 | 29.7% | 0.6% | 5.2% |
| 19 | Stevens † | 41.1 | Lower | 17.7% | 94 | 29.5% | 0.6*% | 5.3% |
| 20 | Okanogan † | 38.4 | Lower | 16.7% | 101 | 29.2% | 0.6*% | 4.5% |
| 21 | Whitman | 38.3 | Lower | 20.4% | 75 | 24.4% | 0.6*% | 7.0% |
| 22 | Spokane | 34.3 | Lower | 24.9% | 49 | 27.1% | 0.7% | 5.3% |
| 23 | Snohomish | 34.2 | Lower | 27.9% | 51 | 30.4% | 0.5% | 4.5% |
| 24 | Chelan † | 33.4 | Lower | 20.7% | 102 | 24.8% | 0.6*% | 3.7% |
| 25 | Kitsap | 29.4 | Lower | 24.3% | 51 | 27.2% | 0.6% | 4.7% |
| 26 | Benton | 29.3 | Lower | 24.3% | 58 | 22.0% | 0.7% | 5.3% |
| 27 | Douglas | 29.1 | Lower | 25.6% | 66 | 25.2% | 0.6*% | 3.9% |
| 28 | Franklin | 26.5 | Lower | 17.8% | 55 | 26.9% | 0.6*% | 5.4% |
| 29 | King | 20.3 | Lower | 21.4% | 50 | 28.1% | 0.3% | 4.8% |
What we will watch
We plan to update this index quarterly, beginning with the first quarter of 2027. Three things will tell us where Washington goes from here. The first is whether the flat first half of 2026 holds or whether filings resume the 40 percent climb of the first half of 2025. The second is whether completed foreclosures keep catching up with starts: lenders repossessed 224 Washington properties in the first quarter of 2026, more than double the 104 of a year earlier (ATTOM Data Solutions), even as the state’s total filings rose 25 percent. The third is the statewide 90-day delinquency rate, 0.6 percent at the end of 2025, and whether Skagit and Yakima counties’ published rates, already above the national rate, pull further away from the Puget Sound counties.
Sources and data
- Foreclosure activity and trend. ATTOM Data Solutions, 2026 Mid-Year U.S. Foreclosure Market Report (published July 16, 2026), Mid-Year 2025 U.S. Foreclosure Market Report (published July 17, 2025), Q1 2026 U.S. Foreclosure Market Report (April 2026), and U.S. Foreclosure Rates by State, August 2026 (published September 18, 2026). Used for statewide filing counts, the national rank, the one-year and two-year changes, first-quarter repossessions, and the counties listed for August filings.
- Historical record. RealtyTrac, 2009 Year-End Foreclosure Market Report (via the Financial Crisis Inquiry Commission archive), the RealtyTrac 2013 year-end foreclosure market report (published January 2014), and the ATTOM 2018 year-end foreclosure market report (published January 2019). Used for the 2009 total, rate, and rank and for the 2013 and 2018 changes.
- Housing market softness. Realtor.com Economic Research, county inventory core metrics through September 2026, and Foreclosures Are Ticking Up (July 2026), for the foreclosure share of listings in the Seattle and Spokane metro areas.
- Housing, mortgage status, cost burden, seasonal homes, and unemployment. U.S. Census Bureau, American Community Survey five-year estimates, 2020 to 2024.
- Current unemployment. U.S. Bureau of Labor Statistics, Local Area Unemployment Statistics, the 12 published months from September 2025 through September 2026 (BLS published no October 2025 figures). Used for the sensitivity test and the current-rate comparisons.
- Mortgage delinquency. CFPB Mortgage Performance Trends, state and county data through December 2025. Used for the 90-or-more day delinquency rates and the national comparison.
- Mediation program. Washington State Department of Commerce, Foreclosure Fairness Program and its annual reports to the Legislature for state fiscal years 2021, 2022, 2023 and 2024, and 2025. Used for referral and hotline counts, program rules, and help lines.
- Local context. Puget Sound Business Journal, Foreclosures are spiking nationally. What about in Seattle? (June 7, 2026), KING 5, Economics professor addresses Seattle area’s shrinking job market (2026), Chinook Observer, Planning ahead, county faces unique challenges (June 17, 2025), Salish Current, San Juans adopt island-by-island vacation rental cap (May 12, 2022), and the San Juan County Comprehensive Plan housing element draft.
- Foreclosure process. Revised Code of Washington 61.24.031, 61.24.040, and 61.24.090, and Northwest Justice Project, WA passes foreclosure prevention bill (May 20, 2025). Help resources from the Department of Commerce, Northwest Justice Project, and HUD.
About NestCash
NestCash buys houses for cash in twelve states and publishes original housing and distressed-property research across U.S. markets. Our original housing research helps homeowners, buyers, and investors understand local market conditions. This report may be cited and its charts embedded with attribution to NestCash.

John is the Founder of NestCash and a leading voice in real estate investing and housing market strategy. With experience across 12 states, he helps buyers, sellers, and investors make smarter decisions using real-world insight and market data.
You're on the list.
We'll email you when the next report is out. One optional question so we can send the right research: