
The 2026 Oregon Foreclosure
Risk Index
Rising faster than the nation, from a low base, with the pressure on the coast
 Published on October 31st, 2026, by John Carter | Founder, NestCash
Original NestCash research, free to read and cite.

Abstract
Oregon has one of the lower foreclosure rates in the country, and one of the faster-rising ones. In the first half of 2026, 1,588 Oregon properties had a foreclosure filing, one for every 1,170 housing units, the 37th-highest rate of any state, against a national rate of one in 632. That count was 32 percent higher than in the first half of 2025, while filings nationally rose 21 percent, and 58 percent higher than two years earlier, against 28 percent nationally (ATTOM Data Solutions). A year ago Oregon ranked 40th. In the first quarter of 2026 the number of homes Oregon lenders repossessed more than doubled from a year earlier, from 80 to 170, one of the five largest increases among states with at least 100 repossessions. At the end of 2025, 0.6 percent of Oregon mortgages were 90 or more days delinquent, against 0.9 percent nationally (Consumer Financial Protection Bureau).
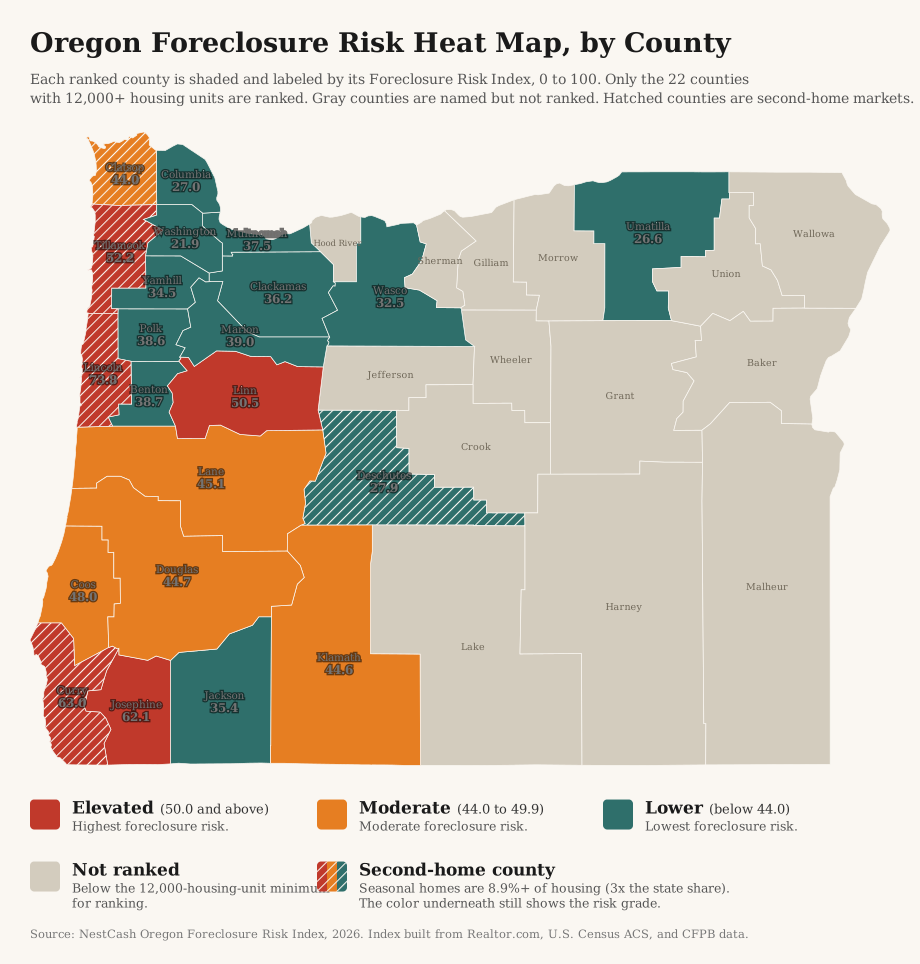
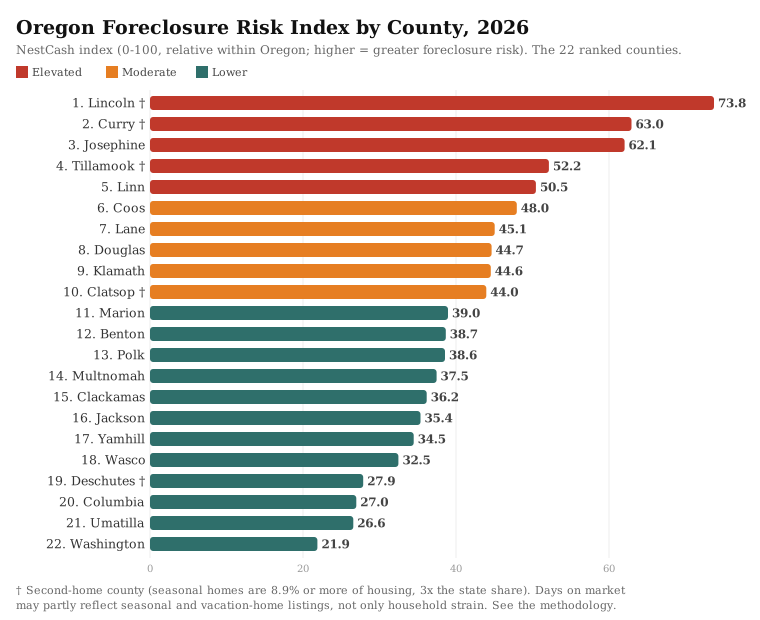
We built a county-level Foreclosure Risk Index from four public datasets to see where that pressure sits. It is not in the Portland metro. Lincoln County, on the central coast, ranks first at 73.8 and holds first place in every version of the index we tested. Curry County, in the far southwest corner, ranks second at 63.0, and Josephine County, inland from it around Grants Pass, third at 62.1. Those three grade Elevated in all five versions, and no other county does. Tillamook County, on the north coast, ranks fourth and Linn County, around Albany, fifth, with the highest published mortgage delinquency rate in the state, 1.0 percent. The five Elevated counties hold 8.5 percent of Oregon’s homes. The counties that hold the most sit at the bottom: Washington County, home to Hillsboro and Intel’s Oregon facilities, ranks last of 22 at 21.9, with Umatilla, Columbia, and Deschutes counties just above it, and Multnomah and Clackamas counties in the lower half. Washington and Clackamas counties have two of the three highest price-cut shares of any ranked county, but their listings sit on the market about two months, their published delinquency rates are 0.4 and 0.5 percent, and Washington County’s owners carry the lightest cost burden of any ranked county.
We score each county from 0 to 100 by blending four public signals, each weighted by how directly it bears on a mortgaged homeowner: market softness (35 percent), mortgage cost burden (30 percent), 90-day mortgage delinquency (20 percent), and unemployment (15 percent). Each signal is min-max normalized within Oregon, so the score ranks counties against one another in the state, not against a national or absolute standard. A county grades Elevated at 50 or above, Moderate from 44 to 49.9, and Lower below 44. We rank counties with at least 12,000 housing units, and 22 of Oregon’s 36 clear that floor, holding 95.2 percent of the state’s homes. Five ranked counties are second-home markets, and we flag them. We tested the index five different ways and report which findings hold in all of them. The full weighting, the normalization, and the limits of the data are spelled out in the methodology section below.
Key findings
- Oregon is rising faster than the nation, from a low base. The 1,588 properties with a filing in the first half of 2026 were 32 percent more than a year earlier, against a 21 percent national increase, and 58 percent more than two years earlier, against 28 percent. The state’s rate still ranks only 37th of 50. Bank repossessions in the first quarter of 2026 more than doubled from a year earlier, from 80 to 170 (ATTOM Data Solutions).
- The coast carries the risk. Lincoln County ranks first, Curry second, and Tillamook fourth, and Clatsop and Coos counties grade Moderate. Josephine County, just inland from Curry, ranks third. The five Elevated counties hold 8.5 percent of the state’s homes. The three counties with the most homes, Multnomah, Washington, and Clackamas, all grade Lower, and Washington County ranks last.
- Lincoln, Curry, and Josephine are the robust findings. Lincoln ranks first in all five versions of the index, and all three grade Elevated in all five. They also carry the three lowest average weekly wages of any ranked county, $966 in Curry, $995 in Josephine, and $1,019 in Lincoln (Bureau of Labor Statistics, first quarter of 2026). Six counties grade Lower in all five versions, including Washington and Deschutes.
- The metros are where listings are softening, not where households are strained. Washington, Lane, Clackamas, Marion, and Linn counties have the five highest shares of listings with a price cut among ranked counties, 32 to 34 percent. But listings there sit on the market about two months and their published delinquency rates run from 0.4 to 1.0 percent, so Linn is the only one of the five that grades Elevated, Lane grades Moderate, and the other three grade Lower. When market softness is measured by price cuts alone, Marion and Clackamas grade Elevated and Linn ranks second.
- Delinquency is low and thinly measured. The CFPB publishes a 90-day delinquency rate for eight Oregon counties. Only Linn, at 1.0 percent, sits above the national 0.9 percent. The others run from 0.6 percent in Marion and Jackson to 0.3 percent in Deschutes, and the statewide rate is 0.6.
- Vacant foreclosures are a larger share here than in most states. For the fourth quarter of 2026, 6.9 percent of Oregon homes in the foreclosure process were vacant, the seventh-highest share of any state and more than double the national 3.0 percent, on a small base of 51 homes. ATTOM listed Multnomah, Jackson, Marion, and Lane counties in that entry, and Columbia, Klamath, Clatsop, and Jefferson counties in its August 2026 filings entry.
You're on the list.
We'll email you when the next report is out. One optional question so we can send the right research:

Methodology
Three limits to read first
We state these before the method because they shape how the Oregon results should be read.
Delinquency data for 8 of 22 ranked counties. The CFPB publishes a 90-day delinquency rate only where a county has enough mortgages in its sample. In Oregon, eight ranked counties qualify: Linn (1.0 percent), Marion (0.6), Jackson (0.6), Multnomah (0.5), Clackamas (0.5), Lane (0.4), Washington (0.4), and Deschutes (0.3). The other 14, including Lincoln, Curry, Josephine, and Tillamook, carry the statewide rate of 0.6 percent. When we remove delinquency from the index, Linn falls from fifth to 11th and grades Lower, and Lane rises from seventh to fifth and grades Elevated. Every delinquency claim in this report is about published rates only.
Three of the five Elevated counties are second-home markets. Median days on market is half of the market-softness input, and in second-home markets it is likely inflated by vacation homes that sit longer on the market. Statewide, 3.0 percent of Oregon homes are held for seasonal, recreational, or occasional use. The default rule in this series flags a county at 5 percent or more, but in Oregon that would flag 14 of 36 counties, so we use three times the statewide share, 8.9 percent, the rule we applied in Washington and Idaho. Ten counties clear it, five of them ranked: Tillamook (33.0 percent), Lincoln (22.4), Clatsop (18.2), Curry (11.9), and Deschutes (11.1). Klamath, at 6.5 percent, and Wasco, at 5.6, are the next ranked counties below the line. Lincoln, Curry, and Tillamook all carry the flag, and we test below how much of their scores rests on days on market.
Unemployment estimates differ. The index uses the Census five-year unemployment estimate, which covers 2020 to 2024 and includes the pandemic shutdowns. In several Oregon counties it runs well above the current rate from the Bureau of Labor Statistics: Benton County, home to Oregon State University, 7.0 percent against 4.3, Wasco 7.7 against 5.2, Lincoln 8.0 against 5.9, and Lane 6.4 against 5.1. The Benton gap is the widest of any ranked county. With current unemployment, Benton falls from 12th to 20th, Lane from seventh to tenth, and Lincoln still ranks first. In other counties the current rate is the higher one: Columbia 5.9 percent against 4.1, Douglas 6.1 against 5.4, Tillamook 5.2 against 4.5, and Josephine 6.9 against 6.4.
We kept the standard formula anyway. Changing the method state by state would break the comparability that makes the series useful, and disclosing where the result is fragile is more useful to readers than tuning it away.
Data and sources
We built the index entirely from public and openly licensed data, and we cite each source at the point of use. Market conditions come from Realtor.com Economic Research (county listing data through September 2026). Housing tenure, mortgage status, cost burden, seasonal homes, county housing counts, and unemployment come from the U.S. Census Bureau’s American Community Survey five-year estimates (2020 to 2024). Mortgage delinquency comes from the Consumer Financial Protection Bureau’s Mortgage Performance Trends (latest data December 2025). Current county unemployment for the sensitivity test comes from the Bureau of Labor Statistics’ Local Area Unemployment Statistics. Statewide filing counts, national ranks, and trends come from ATTOM Data Solutions’ published foreclosure market reports. Every dataset we used is free and publicly available.
Building the index
The Oregon Foreclosure Risk Index uses the same formula as every state in this series, a weighted blend of four signals, each chosen because it precedes or predicts foreclosure among homeowners who carry a mortgage:
35%
The share of active listings with a price cut and the median days a home sits on the market. A soft market matters because a homeowner in trouble who cannot sell quickly has fewer ways to avoid foreclosure. See the note on second-home counties above.
30%
The share of owners with a mortgage who spend 30 percent or more of household income on housing. This is direct payment stress on the exact population that can be foreclosed on.
20%
The 90-day-or-more delinquency rate, the clearest early warning that foreclosures are coming. Published for 8 of the 22 ranked counties. See the note above.
15%
A secondary driver. We hold its weight down deliberately, because unemployment also captures renters and therefore dilutes a signal meant to describe homeowners.
We ranked the 22 counties with at least 12,000 housing units. Smaller ones have few listings in a given month, which makes their market data noisy, and the 22 ranked counties hold 1,768,631 of Oregon’s 1,857,992 homes. We normalized each signal across the ranked set on a 0-to-1 scale, where 0 is the lowest value in that set and 1 is the highest, then applied the weights above and multiplied by 100. The result is a relative score: it ranks Oregon’s counties against one another, not against a national or absolute standard. We then graded each by its score, Elevated for 50.0 or above, Moderate for 44.0 to 49.9, and Lower for anything below 44.0. Five counties land in the Elevated tier, five in Moderate, and 12 in Lower. The five Elevated counties hold 8.5 percent of the state’s homes, and the Elevated and Moderate tiers together hold 25.1 percent.
To test how much the results depend on any one input, we scored the counties five ways. The first is the standard index. The second swaps in current Bureau of Labor Statistics unemployment, the 12 published months from September 2025 through September 2026, for the Census five-year estimate. The third removes delinquency and spreads its weight proportionally across the other three signals. The fourth measures market softness by price cuts alone, which takes days on market, and with it the second-home distortion, out of the index. The fifth combines price cuts alone with current BLS unemployment. When we call a finding robust in this report, it holds in all five.
Other limitations
The index is relative. A grade describes a county’s position among Oregon’s ranked counties, not its risk in absolute terms. Washington County’s score of 21.9 means it sits at or near the low end of the ranked set on most inputs, not that its homeowners face no risk. The index also measures leading pressure, not completed foreclosures or filings, so it will not match any single month’s filing counts. The 14 counties below the housing floor are not ranked, and the index says nothing conclusive about them. Two of them would grade Elevated on the same formula, Wheeler County at 53.0 and Jefferson County at 52.7, above Tillamook and Linn, and Grant and Malheur counties would grade Moderate, so every “highest” and “lowest” in this report is a claim about ranked counties. No two ranked counties tie at the published one-decimal score.
Findings
The index
Ranked from most to least risk on the standard formula. Read the daggered second-home counties with the limits above in mind.
Lincoln County and the central coast
Lincoln County, which runs along the coast from Lincoln City through Newport to Yachats, scores 73.8 and ranks first by more than ten points. It is at or above the middle of the ranked set on every measured input. Its listings sit on the market a median of 100 days, the second-longest of any ranked county, 27.3 percent of them carry a price cut, 11th of 22, 38.8 percent of its homeowners with a mortgage spend 30 percent or more of their income on housing, the second-highest share of any ranked county, and its five-year unemployment estimate, 8.0 percent, is the highest of any ranked county. Its current rate is 5.9 percent, and with current unemployment Lincoln still ranks first. It ranks first in all five versions of the index and grades Elevated in all five, including the version that measures market softness by price cuts alone, where it scores 72.4. That matters because 22.4 percent of Lincoln County’s homes are held for seasonal use, the second-highest share of any ranked county, and its long market times could otherwise be read as a vacation-home artifact. The price-cut share is not one, and neither are the cost burden and unemployment figures.
Lincoln County’s labor market is small. Its seasonally adjusted unemployment rate was 5.7 percent in September 2026, down from 6.3 percent a year earlier, and its nonfarm employment was down 230 jobs, or 1.2 percent, over the year, with retail trade losing 130 of those jobs (Oregon Employment Department). Its average weekly wage in the first quarter of 2026 was $1,019, against $1,481 statewide (Bureau of Labor Statistics). The county has also spent a decade trying to limit vacation rentals in its unincorporated areas. In August 2026 the Oregon Court of Appeals ruled that the county’s vacation-rental ordinance is legal, days after it declined to stop a part of the ordinance that created seven zones where the number of licenses could eventually shrink from 502 to 181 (KLCC and the Lincoln Chronicle).
Tillamook County, to the north, ranks fourth at 52.2. It is the state’s clearest second-home market: 33.0 percent of its homes are held for seasonal use, the highest share of any county in Oregon. Its listings sit on the market a median of 97 days, the third-longest of any ranked county, and 36.8 percent of its mortgaged owners carry a high cost burden, the fourth-highest share. Its unemployment is low, 4.5 percent on the five-year estimate and 5.2 percent currently. On the version that measures softness by price cuts alone, Tillamook falls to 12th and grades Moderate, so part of its Elevated grade does rest on market time. It grades Elevated in the other four versions. Clatsop County, around Astoria and Seaside, ranks tenth at 44.0, the lowest Moderate score, with 18.2 percent of its homes seasonal and a median market time of 88 days. It grades Lower on the price-cut version. ATTOM listed Clatsop County in its Oregon entry for August 2026.
Curry, Josephine, and the southwest
Curry County, in the far southwest corner around Brookings, ranks second at 63.0. Its listings sit on the market a median of 115 days, the longest of any ranked county, 37.4 percent of its mortgaged owners carry a high cost burden, the third-highest share, and its current unemployment rate, 6.2 percent, is above its five-year estimate of 5.8. Its average weekly wage, $966 in the first quarter of 2026, is the lowest of any ranked county and the second-lowest of Oregon’s 36 counties, above only Wheeler County (Bureau of Labor Statistics). Curry carries the second-home flag at 11.9 percent seasonal, and on the price-cut version it falls to sixth, but it still grades Elevated there, and in all five versions.
Josephine County, inland from Curry around Grants Pass, ranks third at 62.1, and its score rests on its households rather than its listings. Of its homeowners with a mortgage, 40.8 percent spend 30 percent or more of their income on housing, the highest share of any ranked county and of any county in the state. Its five-year unemployment estimate is 6.4 percent and its current rate, 6.9 percent, is the second-highest of any ranked county. The Grants Pass area’s seasonally adjusted rate was 6.9 percent in September 2026 (Oregon Employment Department). Only 21.1 percent of its listings carry a price cut, among the lowest shares of any ranked county, and they sit on the market a median of 87 days. Josephine ranks second with current unemployment, third in three other versions, and fourth on price cuts alone, and grades Elevated in all five. It carries no second-home flag. Its average weekly wage, $995, is the second-lowest of any ranked county.
Coos County, around Coos Bay, ranks sixth at 48.0, the highest Moderate score, with a median market time of 85 days and a cost burden of 32.1 percent. It grades Elevated on both versions that measure softness by price cuts alone and Moderate in the other three. Douglas County, around Roseburg, ranks eighth at 44.7. Its current unemployment rate, 6.1 percent, is above its five-year estimate, and with current unemployment it ranks fifth. Jackson County, the Medford area and the largest county in the region with 97,991 homes, ranks 16th at 35.4 and grades Lower in all five versions. Only 20.5 percent of its listings carry a price cut, and its published delinquency rate, 0.6 percent, matches the statewide rate. ATTOM listed Jackson County in its Oregon zombie-foreclosure entry for the fourth quarter of 2026.
Klamath County, east of the Cascades, ranks ninth at 44.6. Its current unemployment rate, 7.1 percent over the 12 published months, is the highest of any ranked county, and its September 2026 rate of 7.0 percent was the highest of any ranked county in the state that month (Oregon Employment Department). But only 18.5 percent of its listings carry a price cut, the second-lowest share of any ranked county, and on the price-cut version it falls to 15th and grades Lower. ATTOM listed Klamath County in its Oregon entry for August 2026.
Linn County and the Willamette Valley
Linn County, around Albany, ranks fifth at 50.5 and is the one Elevated county whose score comes from delinquency and price cuts rather than market time. Its published 90-day delinquency rate, 1.0 percent, is the highest in Oregon and the only published county rate above the national 0.9 percent. Of its listings, 32.4 percent carry a price cut, the fifth-highest share of any ranked county, but they sit on the market a median of 62 days, among the shortest times in the state. Its cost burden, 29.0 percent, is below the middle of the ranked set. The result is a score that moves with the method: without delinquency Linn falls to 11th and grades Lower, with current unemployment it grades Moderate, and on both price-cut versions it ranks second and grades Elevated. We report it as Elevated on the standard index and would describe it as a county where the warning signs are in the mortgage data, not the household data.
The rest of the valley grades Lower. Marion County, around Salem and the state’s fifth-largest county with 132,295 homes, ranks 11th at 39.0. Of its listings, 33.0 percent carry a price cut, the fourth-highest share of any ranked county, but they sit on the market a median of 62 days and its published delinquency rate is 0.6 percent. On both price-cut versions Marion grades Elevated, ranking fifth and seventh. Marion was the only one of Oregon’s seven largest counties where employment grew in the year to March 2026, up 1.4 percent (Bureau of Labor Statistics). ATTOM listed Marion County in its zombie-foreclosure entry for the fourth quarter of 2026. Polk County, the other half of the Salem area, ranks 13th and grades Moderate on the price-cut version. Yamhill County ranks 17th and grades Lower in all five versions. Benton County, home to Oregon State University in Corvallis, ranks 12th at 38.7 on the strength of a 7.0 percent five-year unemployment estimate that its current rate, 4.3 percent, the lowest of any ranked county, does not support. With current unemployment Benton ranks 20th.
Lane County, around Eugene and Springfield, ranks seventh at 45.1 and grades Moderate. It has the second-highest price-cut share of any ranked county, 33.6 percent, a cost burden of 33.3 percent, and a published delinquency rate of 0.4 percent. Its five-year unemployment estimate, 6.4 percent, is well above its current 5.1, so with current unemployment it falls to tenth and grades Lower. Without delinquency, which holds its score down, it rises to fifth and grades Elevated, and on both price-cut versions it grades Elevated, ranking third and fifth. Employment in Lane County fell 1.4 percent in the year to March 2026 (Bureau of Labor Statistics). ATTOM listed Lane County in its zombie-foreclosure entry for the fourth quarter of 2026.
The Portland metro
The Portland metro’s three counties sit in the lower half of the table, and Washington County holds the bottom, ranking last of 22 at 21.9. Its listings sit on the market a median of 58 days, the shortest time of any ranked county, 26.2 percent of its mortgaged owners carry a high cost burden, the lowest share of any ranked county, and its published delinquency rate is 0.4 percent. Its one soft signal is price cuts: 33.8 percent of its active listings carry one, the highest share of any ranked county. On the two price-cut versions Washington rises to 16th, and it grades Lower in all five.
Washington County is also where Intel’s layoffs have landed. Employment there fell 2.8 percent in the year to March 2026, the largest decline among the state’s seven largest counties, while its average weekly wage, $1,882, was the highest in the state and rose 9.2 percent (Bureau of Labor Statistics). In November 2025, Intel told state officials it would lay off another 669 workers at its Hillsboro and Aloha facilities by the end of the year, after cutting around 2,500 positions over the summer, bringing its 2025 cuts in Oregon to more than 3,100. Intel employed around 23,000 people in Oregon at its peak and closer to 18,000 after several rounds of layoffs (OPB). Statewide, semiconductor and electronic component manufacturing employed 25,300 people in September 2026, down 1,600 from a year earlier (Oregon Employment Department). None of that shows up in Washington County’s December 2025 delinquency rate or in this index, and we would not expect it to yet.
Multnomah County, which holds Portland and 371,179 homes, the most of any county, ranks 14th at 37.5. Of its listings, 30.6 percent carry a price cut and they sit on the market a median of 66 days, its cost burden is 30.4 percent, and its published delinquency rate is 0.5 percent. It grades Lower in three versions and Moderate on the two price-cut versions. Employment in the county fell 1.9 percent in the year to March 2026 (Bureau of Labor Statistics), and the Oregonian reported in August 2026 that it was nearly 7 percent below its 2019 peak. The county’s condo market has been falling: the median condo in Multnomah County sold for $335,000 in 2022 and $300,000 in 2025, a 10 percent decline, according to Regional Multiple Listing Service figures reported by the Oregonian. In the Portland-Vancouver-Hillsboro metro area, foreclosures made up 1.5 percent of home listings in the appendix to Realtor.com’s July 2026 report, against a national share of 1.3 percent in April 2026. ATTOM listed Multnomah County in its Oregon zombie-foreclosure entry for the fourth quarter of 2026.
Clackamas County ranks 15th at 36.2 with the third-highest price-cut share of any ranked county, 33.4 percent, a median market time of 67 days, a published delinquency rate of 0.5 percent, and a five-year unemployment estimate of 4.4 percent. On both price-cut versions it grades Elevated, ranking eighth in each. Columbia County, north of Portland along the Columbia River, ranks 20th at 27.0 with the lowest five-year unemployment estimate of any ranked county, 4.1 percent, against a current rate of 5.9, and it grades Moderate when current unemployment is combined with price cuts alone. ATTOM listed Columbia County in its Oregon entry for August 2026.
Central and eastern Oregon
Deschutes County, around Bend, ranks 19th at 27.9 and grades Lower in all five versions. Its published delinquency rate, 0.3 percent, is the lowest in Oregon, only 20.4 percent of its listings carry a price cut, and its current unemployment rate is 4.8 percent. It carries the second-home flag at 11.1 percent seasonal, and its listings sit on the market a median of 83 days, but the price-cut version, which drops market time, leaves it 21st. Wasco County, around The Dalles, ranks 18th with the lowest price-cut share of any ranked county, 14.9 percent, and a five-year unemployment estimate, 7.7 percent, that its current rate of 5.2 does not support. Umatilla County, around Pendleton and Hermiston, ranks 21st at 26.6. Both grade Lower in all five versions. Jefferson County, north of Bend, is too small to be ranked but would score 52.7 on the same formula. ATTOM listed it in its Oregon entry for August 2026.
How today compares with the last crisis
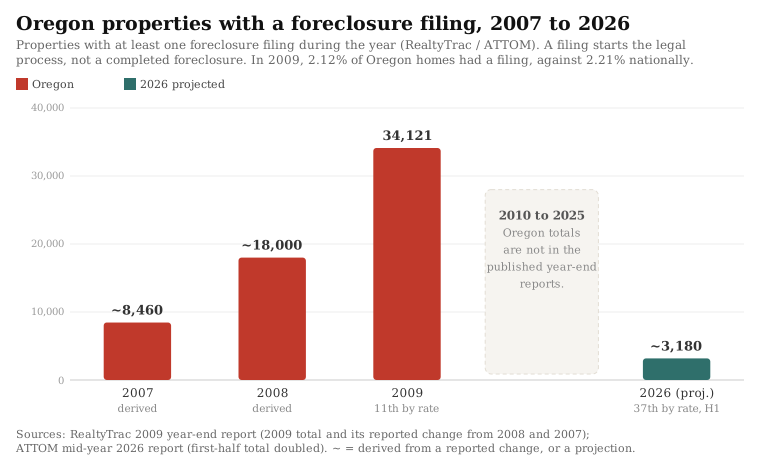
In 2009, 34,121 Oregon properties had a foreclosure filing, 2.12 percent of the state’s housing units, against 2.21 percent nationally. That rate ranked Oregon 11th among the states (RealtyTrac). The published year-end reports we hold do not give Oregon’s totals for 2010 through 2025, so the chart shows those years as a gap rather than estimating them. What they do show is a process that stalled and restarted. Oregon’s foreclosure activity fell 40 percent in 2012, one of 25 states where it declined, and the years after brought the backlog through: foreclosure starts in Oregon rose 52 percent in December 2013 from the month before, scheduled auctions in the fourth quarter of 2014 were up 152 percent from a year earlier, and bank repossessions rose 38 percent in 2014, when Oregon was one of nine states where they rose against a national decline, and 96 percent in 2015 (RealtyTrac). Those years bracket the period in which Oregon’s courts settled, in Niday v. GMAC Mortgage and Brandrup v. ReconTrust in 2013, who may act as the beneficiary of a trust deed and what must be recorded before a trustee’s sale. Homes foreclosed in Oregon in the fourth quarter of 2016 had spent an average of 362 days in the process, the third-shortest timeline of any state (ATTOM Data Solutions). In 2020, foreclosure starts in Oregon fell 79 percent, the largest decline among the states ATTOM named. At its first-half pace, Oregon is on track for about 3,180 properties with a filing in 2026, about 0.17 percent of its housing units, against about 0.32 percent nationally. That is less than a tenth of the 2009 count.
How Oregon compares with its neighbors
In the first half of 2026, Oregon’s foreclosure rate was one in 1,170 housing units (ATTOM Data Solutions). That was lower than in Nevada, where Nye County ranks first in our county index (one in 452), California, where our county index puts Lake County first (one in 680), and Idaho, where Bonner County leads our county index (one in 820). It was higher than in Washington, where Grays Harbor County ranks first in our county index (one in 1,332).
If you are an Oregon homeowner facing foreclosure
This report is a market analysis, not legal advice, but the data points to a few things worth knowing. Oregon allows both kinds of foreclosure. A home financed with a trust deed can be sold by a trustee without a court case, by advertisement and sale, once a notice of default is recorded with the county, and a lender can instead foreclose in court (ORS 86.752). Before either one starts, a lender that forecloses on more than 30 homes a year must offer to meet you. A lender that intends to foreclose a residential trust deed must first request a resolution conference with the homeowner, a meeting with a neutral mediator, before it files a notice of default or brings suit, unless it swears to the Attorney General that it started no more than 30 foreclosures in the previous year (ORS 86.726). If your lender does not request one, you can, so long as no notice of default has been filed and a housing counselor certifies in writing that you are more than 30 days behind or have a hardship that may qualify you for help. The program is run for the state by Mediation Case Manager at 855-658-6733 and overseen by the Oregon Department of Justice. If your income is low, all but $50 of your fee may be waived, but the fee deadline is set by law, and if you miss it the conference is cancelled and your lender may foreclose without further delay (Oregon Housing and Community Services).
In a trustee’s sale, the notice of sale must be served or mailed to you at least 120 days before the sale date (ORS 86.764). Up to five days before the sale, you can stop it by paying the amount then due under the loan, not counting any part that would not yet be due had there been no default, plus trustee’s and attorney fees, which are capped at $1,000 on a residential trust deed. The foreclosure is then dismissed and the loan reinstated as though no acceleration had taken place (ORS 86.778). The sale itself is a public auction to the highest bidder for cash, held between 9 a.m. and 4 p.m. in the county where the home sits, and the trustee can postpone it, by announcement at the time and place of sale, for up to 180 days in total from the original date (ORS 86.782). The federal Homeowner Assistance Fund in Oregon stopped accepting new applications on July 17, 2026 (Oregon Housing and Community Services), so the resolution conference and a housing counselor are the places to start.
Help is available. A HUD-approved housing counselor can review your options at no cost: call (800) 569-4287 to find one near you (HUD). Low-cost or free legal help for low-income homeowners affected by foreclosure is available statewide through the Oregon State Bar’s referral service at 503-684-3763, or toll-free in Oregon at 800-452-7636, and through the legal aid directory at OregonLawHelp.org (Oregon Housing and Community Services, Oregon Department of Justice). The Department of Justice’s consumer hotline is 1-877-877-9392 (Oregon DOJ). Be wary of anyone who charges up-front fees to stop a foreclosure or asks you to sign over the deed to your home.
The full data
The 22 ranked counties, from highest to lowest Foreclosure Risk Index. An asterisk on the delinquency rate marks a county where the Oregon statewide rate was substituted because its own rate is not separately reported. A dagger marks a second-home county, where seasonal homes are 8.9 percent or more of housing, three times the statewide share. Unemployment is the five-year Census estimate used in the index.
| Rank | County | FRI | Grade | Price cuts | Median DOM | Cost burden | 90+ delinq | Unemployment |
|---|---|---|---|---|---|---|---|---|
| 1 | Lincoln † | 73.8 | Elevated | 27.3% | 100 | 38.8% | 0.6*% | 8.0% |
| 2 | Curry † | 63.0 | Elevated | 22.9% | 115 | 37.4% | 0.6*% | 5.8% |
| 3 | Josephine | 62.1 | Elevated | 21.1% | 87 | 40.8% | 0.6*% | 6.4% |
| 4 | Tillamook † | 52.2 | Elevated | 23.9% | 97 | 36.8% | 0.6*% | 4.5% |
| 5 | Linn | 50.5 | Elevated | 32.4% | 62 | 29.0% | 1.0% | 6.0% |
| 6 | Coos | 48.0 | Moderate | 27.5% | 85 | 32.1% | 0.6*% | 6.0% |
| 7 | Lane | 45.1 | Moderate | 33.6% | 63 | 33.3% | 0.4% | 6.4% |
| 8 | Douglas | 44.7 | Moderate | 29.7% | 86 | 30.5% | 0.6*% | 5.4% |
| 9 | Klamath | 44.6 | Moderate | 18.5% | 80 | 33.0% | 0.6*% | 7.2% |
| 10 | Clatsop † | 44.0 | Moderate | 23.9% | 88 | 33.8% | 0.6*% | 4.7% |
| 11 | Marion | 39.0 | Lower | 33.0% | 62 | 30.0% | 0.6% | 5.3% |
| 12 | Benton | 38.7 | Lower | 27.7% | 63 | 28.9% | 0.6*% | 7.0% |
| 13 | Polk | 38.6 | Lower | 26.5% | 70 | 30.8% | 0.6*% | 5.7% |
| 14 | Multnomah | 37.5 | Lower | 30.6% | 66 | 30.4% | 0.5% | 5.7% |
| 15 | Clackamas | 36.2 | Lower | 33.4% | 67 | 30.8% | 0.5% | 4.4% |
| 16 | Jackson | 35.4 | Lower | 20.5% | 70 | 32.5% | 0.6% | 5.4% |
| 17 | Yamhill | 34.5 | Lower | 27.0% | 81 | 28.6% | 0.6*% | 4.8% |
| 18 | Wasco | 32.5 | Lower | 14.9% | 88 | 26.6% | 0.6*% | 7.7% |
| 19 | Deschutes † | 27.9 | Lower | 20.4% | 83 | 33.0% | 0.3% | 4.4% |
| 20 | Columbia | 27.0 | Lower | 29.2% | 73 | 26.5% | 0.6*% | 4.1% |
| 21 | Umatilla | 26.6 | Lower | 21.7% | 67 | 28.9% | 0.6*% | 5.0% |
| 22 | Washington | 21.9 | Lower | 33.8% | 58 | 26.2% | 0.4% | 4.5% |
What we will watch
We plan to update this index quarterly, beginning with the first quarter of 2027. Three things will tell us where Oregon goes from here. The first is the filing trend: first-half filings rose 20 percent in 2025 and 32 percent in 2026, first-quarter filings were up 50 percent from a year earlier, and repossessions doubled, so the question is whether a state that ranks 37th keeps climbing the table. The second is the coast, where the three Elevated second-home counties carry long market times that a soft vacation-home market could stretch further, and where the next Realtor.com and CFPB releases will show whether price cuts and delinquency follow. The third is Washington County, where the largest employment decline among Oregon’s big counties had not reached the December 2025 delinquency figures, and where the next CFPB release will show whether its 0.4 percent holds.
Sources and data
- Foreclosure activity and trend. ATTOM Data Solutions, 2026 Mid-Year U.S. Foreclosure Market Report (published July 16, 2026), Mid-Year 2025 U.S. Foreclosure Market Report (July 2025), Q1 2026 U.S. Foreclosure Market Report (April 16, 2026), U.S. Foreclosure Rates by State, August 2026 (published September 18, 2026), and Zombie Foreclosure Rates by State, Q4 2026 (published October 30, 2026). Used for statewide filing counts, the national rank, the one-year and two-year changes, bank repossessions, the counties listed for August filings, and the zombie-foreclosure share.
- Historical record. RealtyTrac, 2009 Year-End Foreclosure Market Report (via the Financial Crisis Inquiry Commission archive), and the RealtyTrac and ATTOM year-end foreclosure market reports for 2012, 2013, 2014, 2015, 2016, and 2020. Used for the 2009 total, rate, and rank, the 2012 to 2015 changes, the 2016 timeline, and the 2020 change in starts.
- Housing market softness. Realtor.com Economic Research, county inventory core metrics through September 2026, and Foreclosures Are Ticking Up (July 7, 2026), for the foreclosure share of listings in the Portland metro area and nationally.
- Housing, mortgage status, cost burden, seasonal homes, and unemployment. U.S. Census Bureau, American Community Survey five-year estimates, 2020 to 2024.
- Current unemployment and wages. U.S. Bureau of Labor Statistics, Local Area Unemployment Statistics, the 12 published months from September 2025 through September 2026 (BLS published no October 2025 figures), used for the sensitivity test and the current-rate comparisons. BLS, County Employment and Wages in Oregon, First Quarter 2026 (September 4, 2026), for county employment changes and average weekly wages. Oregon Employment Department, Oregon’s Unemployment Rate Was 5.0% in September (October 14, 2026) and Employment in Lincoln County: September 2026 (October 20, 2026), for the statewide and county rates for September 2026.
- Mortgage delinquency. CFPB Mortgage Performance Trends, state and county data through December 2025. Used for the 90-or-more day delinquency rates and the national comparison.
- Local context. OPB, Intel will cut another 669 workers in Oregon by the end of 2025 (November 13, 2025), The Oregonian/OregonLive, Oregon unemployment rate climbed from middle of the pack to near the top (August 9, 2026) and Portland condo prices are sinking (March 16, 2026), and KLCC with the Lincoln Chronicle, Lincoln County’s vacation rental ordinance is legal, Oregon Court of Appeals rules (August 20, 2026).
- Foreclosure process. Oregon Revised Statutes 86.726, 86.752, 86.764, 86.778, and 86.782, with the annotations citing Niday v. GMAC Mortgage, LLC, 353 Or 648 (2013) and Brandrup v. ReconTrust Co., 353 Or 668 (2013). Help resources from Oregon Housing and Community Services, the Oregon Department of Justice, Oregon Law Help, and HUD.
About NestCash
NestCash buys houses for cash in twelve states and publishes original housing and distressed-property research across U.S. markets. Our original housing research helps homeowners, buyers, and investors understand local market conditions. This report may be cited and its charts embedded with attribution to NestCash.

John is the Founder of NestCash and a leading voice in real estate investing and housing market strategy. With experience across 12 states, he helps buyers, sellers, and investors make smarter decisions using real-world insight and market data.
You're on the list.
We'll email you when the next report is out. One optional question so we can send the right research: