
The 2026 Alabama Foreclosure Risk Index
Where financial pressure on Alabama homeowners is building, county by county
 Published on October 13th, 2026, by John Carter | Founder, NestCash
Original NestCash research, free to read and cite.

Abstract
Alabama is moving up the foreclosure table. In the first half of 2026 the state recorded 3,671 foreclosure filings, one for every 637 housing units, the 15th-highest rate in the country and essentially level with the national rate. Filings were up 21 percent from the first half of 2025 and 43 percent from the first half of 2024, and by August Alabama had the 10th-worst foreclosure rate of any state (ATTOM Data Solutions). The share of Alabama mortgages 90 or more days delinquent has risen from 0.8 percent at the end of 2023 to 1.1 percent at the end of 2025, above the national 0.9 percent, though well below its neighbors to the west, Louisiana at 2.1 percent and Mississippi at 1.8 percent (Consumer Financial Protection Bureau).
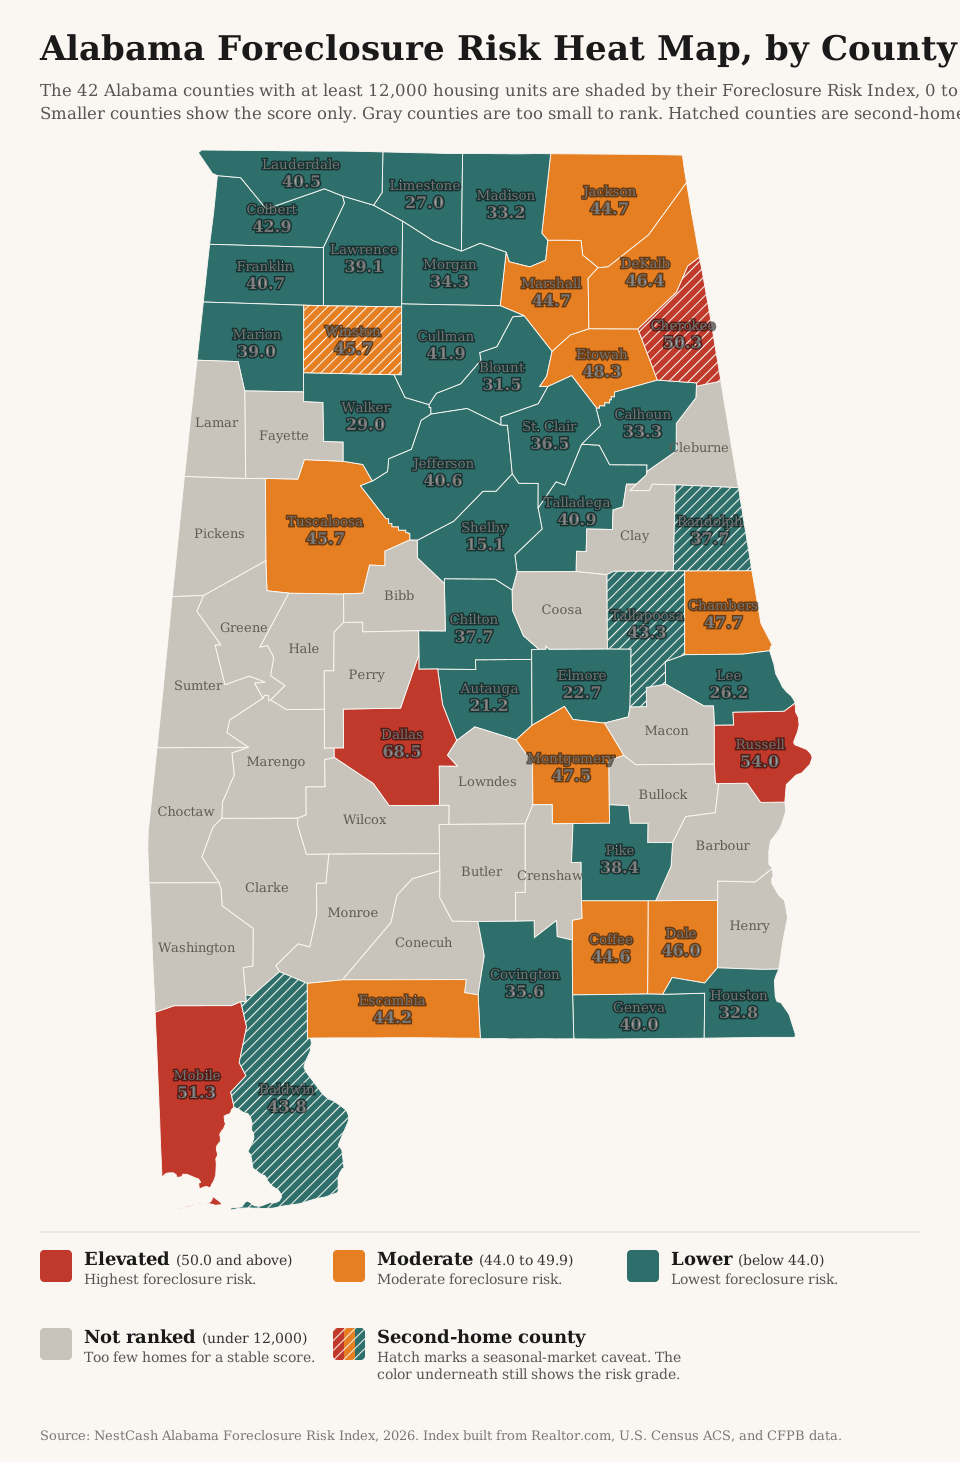
We built a county-level Foreclosure Risk Index from four public datasets to see where the pressure sits. It is concentrated in a few places. Dallas County, home to Selma, ranks first by a wide margin, 14.5 points ahead of the next county, and grades Elevated in every version of the index we tested. Dallas lies in Alabama’s Black Belt, a crescent-shaped region of counties across the south-central part of the state that extends into Mississippi. The name first referred to the region’s dark, fertile prairie soil, which made it the center of the state’s cotton-plantation economy, and it is also used today for the region’s majority-Black communities and their long history of economic hardship. In this report we use it as a geographic term for that region. Russell County, home to Phenix City on the Georgia line, is the only other county Elevated in all five. Mobile County is the one large metro county in the Elevated tier. Alabama’s biggest economic centers sit at the other end: Jefferson County (Birmingham) and Madison County (Huntsville) grade Lower, and the suburban counties around Birmingham, Montgomery, and Auburn have the lowest scores in the state, led by Shelby County at 15.1.
We score each county from 0 to 100 by blending four public signals, each weighted by how directly it bears on a mortgaged homeowner: market softness (35 percent), mortgage cost burden (30 percent), 90-day mortgage delinquency (20 percent), and unemployment (15 percent). Each signal is min-max normalized within Alabama, so the score ranks counties against one another in the state, not against a national or absolute standard. A county grades Elevated at 50 or above, Moderate from 44 to 49.9, and Lower below 44. One rule keeps the ranking honest: we rank the 42 counties with at least 12,000 housing units. Alabama has 67 counties, and the other 25 have too few homes for sale to score a market reliably, so they stay in the data but are not ranked. The 42 ranked counties hold 91.9 percent of the state’s homes. Because some of Alabama’s results lean on inputs that need care, we tested the index five different ways and report which findings hold in all of them. The full weighting, the normalization, and the limits of the data are spelled out in the methodology section below.
Key findings
- Alabama is climbing the national table. It ranked 15th by foreclosure rate in the first half of 2026 and 10th in August, one filing for every 3,016 housing units. First-half filings were up 43 percent from two years earlier (ATTOM Data Solutions).
- Selma leads the state by a wide margin. Dallas County scores 68.5, 14.5 points ahead of second place, with the heaviest housing cost burden of any ranked county, 37.7 percent, and the highest five-year unemployment rate, 11.0 percent. It ranks first in three of the five versions of the index and second in the other two.
- Phenix City and Mobile follow. Russell County (54.0) grades Elevated in every version and ranks first when market softness is measured by price cuts alone. Mobile County (51.3) has the second-highest published delinquency rate in the state, 1.6 percent, and grades Elevated in four of five versions.
- Birmingham and Huntsville score low. Madison County (33.2) grades Lower in every version and Jefferson County (40.6) in three of five, and Shelby County, south of Birmingham, is the lowest-scoring county in the state at 15.1, with the lowest published delinquency rate, 0.4 percent.
- Tuscaloosa is the delinquency outlier. Its 2.0 percent delinquency rate is the highest published rate in Alabama, but its market and cost measures are moderate, and it grades Moderate at 45.7.
Methodology
Three limits to read first
We state these before the method because they shape how the Alabama results should be read.
Delinquency data for eight of 42 ranked counties. The CFPB publishes a county’s 90-day delinquency rate only when the county has enough mortgages in its sample. In Alabama, eight ranked counties qualify: Jefferson, Mobile, Madison, Baldwin, Montgomery, Tuscaloosa, Lee, and Shelby. The other 34, including Dallas and Russell, carry the statewide rate of 1.1 percent. Dallas County’s first-place score therefore rests on cost burden, unemployment, and a slow market, not on a measured delinquency rate, and it still ranks first when delinquency is removed from the index entirely.
Second-home counties. Median days on market is half of the market-softness input, and in Alabama’s lake and beach counties it is likely inflated by vacation homes that sit longer on the market. Statewide, 3.1 percent of Alabama’s homes are held for seasonal, recreational, or occasional use, and the 5 percent cutoff we have used in several states would flag 21 of Alabama’s 67 counties. As in our Utah and California indexes, we instead flag counties at three times the statewide share, 9.2 percent. Five ranked counties clear that line: Tallapoosa (14.8 percent, Lake Martin), Cherokee (14.6 percent, Weiss Lake), Baldwin (14.6 percent, Gulf Shores and Orange Beach), Winston (13.0 percent, Smith Lake), and Randolph (11.7 percent). Tuscaloosa, at 5.5 percent, is the next county below the line. Cherokee County ranks fourth on the standard index but falls to Lower when market softness is measured by price cuts alone, so we do not count it among the robust findings.
The smallest Black Belt counties are not ranked. Many of Alabama’s most economically distressed counties, among them Lowndes, Wilcox, Perry, Sumter, Greene, Hale, Bullock, and Macon, have fewer than 12,000 housing units and too few listings to score reliably. Dallas County is the Black Belt county large enough to rank, and its result should be read as a signal for the region around it, not as a claim that the counties next to it are unaffected.
We kept the standard formula anyway. Changing the method state by state would break the comparability that makes the series useful, and disclosing where the result is fragile is more useful to readers than tuning it away.
Data and sources
We built the index entirely from public and openly licensed data, and we cite each source at the point of use. Market conditions come from Realtor.com Economic Research (county listing data through September 2026). Housing tenure, mortgage status, cost burden, seasonal homes, county housing counts, and unemployment come from the U.S. Census Bureau’s American Community Survey five-year estimates (2020 to 2024). Mortgage delinquency comes from the Consumer Financial Protection Bureau’s Mortgage Performance Trends (latest data December 2025). Current county unemployment for the sensitivity test comes from the Bureau of Labor Statistics’ Local Area Unemployment Statistics. Statewide filing counts, national ranks, and trends come from ATTOM Data Solutions’ published foreclosure market reports. Every dataset we used is free and publicly available.
Building the index
The Alabama Foreclosure Risk Index uses the same formula as every state in this series, a weighted blend of four signals, each chosen because it precedes or predicts foreclosure among homeowners who carry a mortgage:
35%
The share of active listings with a price cut and the median days a home sits on the market. A soft market matters because a homeowner in trouble who cannot sell quickly has fewer ways to avoid foreclosure. See the note on second-home counties above.
30%
The share of owners with a mortgage who spend more than 30 percent of household income on housing. This is direct payment stress on the exact population that can be foreclosed on.
20%
The 90-day-or-more delinquency rate, the clearest early warning that foreclosures are coming. Published for eight of Alabama’s 42 ranked counties. See the note above.
15%
A secondary driver. We hold its weight down deliberately, because unemployment also captures renters and therefore dilutes a signal meant to describe homeowners.
We normalized each signal across the 42 ranked counties on a 0-to-1 scale, where 0 is the lowest value in that set and 1 is the highest, then applied the weights above and multiplied by 100. The result is a relative score: it ranks Alabama counties against one another, not against a national or absolute standard. We then graded each county by its score, Elevated for 50.0 or above, Moderate for 44.0 to 49.9, and Lower for anything below 44.0. Four counties land in the Elevated tier, 11 in Moderate, and 27 in Lower. Because Dallas County sits so far ahead of the field, it stretches the top of the scale, and fewer counties reach the Elevated tier than in most states.
To test how much the results depend on any one input, we scored the counties five ways: the standard index; the standard index with current Bureau of Labor Statistics unemployment, the 12 published months from August 2025 through August 2026, in place of the Census five-year estimate; the index with delinquency removed and its weight spread proportionally across the other three signals; the index with market softness measured by price cuts alone; and price cuts alone combined with current BLS unemployment. When we call a finding robust in this report, it holds in all five.
Other limitations
The index is relative. A Lower grade means lower measured risk than other Alabama counties, not low risk in absolute terms. It also measures leading pressure, not completed foreclosures or filings, so it will not match any single month’s filing counts. ATTOM’s August 2026 state rankings listed Henry, Bibb, Marshall, and Fayette counties under Alabama. Marshall grades Moderate on our index, and Henry, Bibb, and Fayette are below our 12,000-home floor. Counties that tie at the published one-decimal score share a rank.
Findings
The index
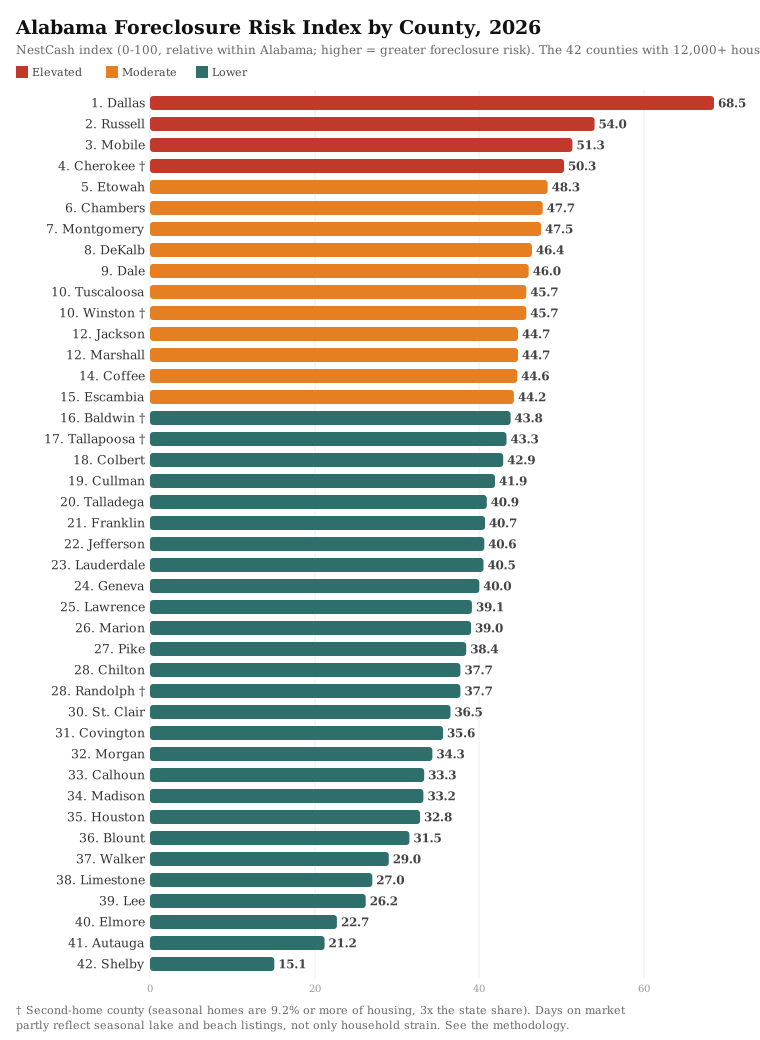
Ranked from most to least risk on the standard formula. Read the daggered second-home counties with the limits above in mind.
Selma and the Black Belt
Dallas County scores 68.5, the highest in Alabama and 14.5 points ahead of Russell County in second place. It ranks first in three of the five versions of the index and second in the other two, and it does not depend on any single input. Its mortgaged owners carry the heaviest housing cost burden of any ranked county, 37.7 percent, its five-year unemployment estimate, 11.0 percent, is the highest of any ranked county, and its homes sat a median of 80 days on the market in September 2026. The unemployment figure has improved since: the current 12-month rate is 4.8 percent, and Dallas still ranks first with it. Dallas sits near the center of the Black Belt, where several neighboring counties are too small to rank but share the same long-term economic pressures.
Phenix City and the Georgia line
Russell County, home to Phenix City, ranks second at 54.0 and grades Elevated in every version of the index, and it ranks first when market softness is measured by price cuts alone. Its owners carry the second-highest cost burden of any ranked county, 34.6 percent. Phenix City sits across the Chattahoochee River from Columbus, Georgia, and the two sides of the river look very different: Muscogee County, home to Columbus, grades Lower in our Georgia Foreclosure Risk Index. Chambers County (47.7), farther up the state line, grades Moderate.
Mobile and the Gulf Coast
Mobile County scores 51.3 and is the only large metro county in Alabama’s Elevated tier. Its 1.6 percent delinquency rate is the second highest published rate in the state, and it grades Elevated in four of the five versions, slipping to Moderate only when delinquency is removed. Baldwin County, across Mobile Bay, grades Lower at 43.8. It is a second-home county, with its delinquency rate at 0.8 percent.
Montgomery, Tuscaloosa, and the middle of the table
Montgomery County grades Moderate at 47.5 in every version of the index, with a 1.3 percent delinquency rate, the third highest published rate in the state. Tuscaloosa County is the clearest case of how the index weighs its inputs. Its 2.0 percent delinquency rate is the highest published rate in Alabama, but its owners carry a lower cost burden, 21.5 percent, and it grades Moderate at 45.7. Without delinquency in the score, it falls to 32.1. In northeast Alabama, Etowah County, home to Gadsden, grades Moderate at 48.3 and rises to Elevated on price cuts alone. Etowah ranks fifth among 1,129 U.S. counties on our Vacant & Abandoned Property Index, and neighboring Calhoun County, home to Anniston, ranks 18th, though Calhoun grades Lower here at 33.3. Abandonment and foreclosure pressure overlap, but they are not the same problem.
Birmingham, Huntsville, and the suburbs
Alabama’s two largest economic centers score low. Jefferson County, the largest in the state with 310,789 homes, grades Lower at 40.6, with a 1.2 percent delinquency rate. Madison County, home to Huntsville, scores 33.2, with a 0.6 percent delinquency rate. The lowest-scoring counties in Alabama are the suburbs: Shelby County (15.1), south of Birmingham, has the lowest published delinquency rate in the state, 0.4 percent, followed by Autauga (21.2) and Elmore (22.7) outside Montgomery and Lee County (26.2), home to Auburn and Opelika, at 0.5 percent.
How today compares with the last crisis
Alabama was never a crisis state by filing rate. In 2009, 19,896 Alabama properties received a foreclosure filing, 0.93 percent of the state’s housing against 2.21 percent nationally, which ranked Alabama 30th among the states (RealtyTrac). It has also had some of the fastest foreclosures in the country, among the five shortest average timelines in the fourth quarters of 2012 (163 days), 2013 (227 days), and 2016 (363 days). That is the opposite of Louisiana, where foreclosures now take the longest in the nation. Because Alabama’s annual rate is not published in most later year-end reports, we do not show a history chart. At its first-half pace, Alabama is on track for a 2026 foreclosure rate of roughly 0.31 percent of homes, essentially the national pace and about a third of its 2009 rate.
If you are an Alabama homeowner facing foreclosure
This report is a market analysis, not legal advice, but the data points to a few things worth knowing. Most Alabama foreclosures happen outside of court, under a power of sale in the mortgage. The sale must be advertised once a week for three successive weeks in a newspaper in the county where the property is located (Code of Alabama § 35-10-13). A lender can also choose to foreclose through the courts, and Alabama allows a lender to pursue a deficiency judgment if the sale does not cover the debt (Nolo).
Alabama gives homeowners a right to redeem the home after the sale: 180 days for residential property on which a homestead exemption was claimed, and one year for other property (§ 6-5-248). That right is fragile. If the buyer at the sale makes a written demand for possession and the home is not handed over within 10 days, the right of redemption is forfeited (§ 6-5-251). Anyone planning to redeem can make a written demand for a statement of the debt and lawful charges (§ 6-5-252).
Free help is available. A HUD-approved housing counselor can review your options at no cost. Call (800) 569-4287 to find one near you (HUD), or use the CFPB’s housing counselor search. Legal Services Alabama provides free civil legal help at 866-456-4995 (LSA), and the Alabama State Bar lists volunteer lawyer programs by region on its legal help page. The Alabama State Banking Department, which licenses mortgage lenders, takes complaints at (334) 242-3452 (State Banking Department). The state’s Mortgage Assistance Alabama program is permanently closed. Be wary of anyone who charges up-front fees to stop a foreclosure or asks you to sign over the deed to your home.
The full data
All 42 ranked counties, from highest to lowest Foreclosure Risk Index. An asterisk on the delinquency rate marks a county where the Alabama statewide rate was substituted because its own rate is not separately reported. A dagger marks a second-home county, where seasonal homes are 9.2 percent or more of housing. Unemployment is the five-year Census estimate used in the index. Counties that tie at the published score share a rank.
| Rank | County | FRI | Grade | Price cuts | Median DOM | Cost burden | 90+ delinq | Unemployment |
|---|---|---|---|---|---|---|---|---|
| 1 | Dallas | 68.5 | Elevated | 11.4% | 80 | 37.7% | 1.1*% | 11.0% |
| 2 | Russell | 54.0 | Elevated | 19.3% | 55 | 34.6% | 1.1*% | 6.2% |
| 3 | Mobile | 51.3 | Elevated | 19.9% | 66 | 26.9% | 1.6% | 5.3% |
| 4 | Cherokee † | 50.3 | Elevated | 13.6% | 96 | 28.6% | 1.1*% | 3.9% |
| 5 | Etowah | 48.3 | Moderate | 20.6% | 70 | 27.0% | 1.1*% | 5.9% |
| 6 | Chambers | 47.7 | Moderate | 16.5% | 58 | 32.7% | 1.1*% | 5.1% |
| 7 | Montgomery | 47.5 | Moderate | 18.8% | 72 | 25.5% | 1.3% | 5.9% |
| 8 | DeKalb | 46.4 | Moderate | 21.0% | 80 | 25.2% | 1.1*% | 4.1% |
| 9 | Dale | 46.0 | Moderate | 21.3% | 62 | 26.2% | 1.1*% | 6.6% |
| 10 | Tuscaloosa | 45.7 | Moderate | 17.7% | 63 | 21.5% | 2.0% | 5.8% |
| 10 | Winston † | 45.7 | Moderate | 16.7% | 93 | 24.8% | 1.1*% | 3.6% |
| 12 | Jackson | 44.7 | Moderate | 21.6% | 71 | 25.4% | 1.1*% | 4.5% |
| 12 | Marshall | 44.7 | Moderate | 18.9% | 94 | 22.3% | 1.1*% | 3.9% |
| 14 | Coffee | 44.6 | Moderate | 22.7% | 68 | 24.7% | 1.1*% | 5.1% |
| 15 | Escambia | 44.2 | Moderate | 8.1% | 63 | 28.8% | 1.1*% | 10.1% |
| 16 | Baldwin † | 43.8 | Lower | 17.6% | 87 | 27.5% | 0.8% | 3.0% |
| 17 | Tallapoosa † | 43.3 | Lower | 20.3% | 90 | 20.4% | 1.1*% | 4.9% |
| 18 | Colbert | 42.9 | Lower | 27.4% | 69 | 22.8% | 1.1*% | 3.1% |
| 19 | Cullman | 41.9 | Lower | 21.4% | 77 | 23.1% | 1.1*% | 3.8% |
| 20 | Talladega | 40.9 | Lower | 16.3% | 67 | 24.5% | 1.1*% | 6.8% |
| 21 | Franklin | 40.7 | Lower | 20.8% | 66 | 25.4% | 1.1*% | 3.6% |
| 22 | Jefferson | 40.6 | Lower | 19.2% | 63 | 25.0% | 1.2% | 4.7% |
| 23 | Lauderdale | 40.5 | Lower | 25.0% | 69 | 21.6% | 1.1*% | 4.1% |
| 24 | Geneva | 40.0 | Lower | 18.9% | 63 | 24.6% | 1.1*% | 5.6% |
| 25 | Lawrence | 39.1 | Lower | 20.8% | 79 | 23.1% | 1.1*% | 2.0% |
| 26 | Marion | 39.0 | Lower | 17.0% | 69 | 24.3% | 1.1*% | 5.0% |
| 27 | Pike | 38.4 | Lower | 10.8% | 79 | 26.7% | 1.1*% | 3.7% |
| 28 | Chilton | 37.7 | Lower | 18.3% | 71 | 21.7% | 1.1*% | 5.5% |
| 28 | Randolph † | 37.7 | Lower | 10.3% | 91 | 23.6% | 1.1*% | 3.8% |
| 30 | St. Clair | 36.5 | Lower | 18.4% | 70 | 22.1% | 1.1*% | 4.6% |
| 31 | Covington | 35.6 | Lower | 15.0% | 84 | 19.6% | 1.1*% | 5.2% |
| 32 | Morgan | 34.3 | Lower | 21.8% | 68 | 20.1% | 1.1*% | 3.7% |
| 33 | Calhoun | 33.3 | Lower | 17.4% | 61 | 21.2% | 1.1*% | 6.0% |
| 34 | Madison | 33.2 | Lower | 22.4% | 83 | 19.7% | 0.6% | 3.6% |
| 35 | Houston | 32.8 | Lower | 20.4% | 51 | 23.0% | 1.1*% | 4.5% |
| 36 | Blount | 31.5 | Lower | 17.7% | 56 | 22.1% | 1.1*% | 5.0% |
| 37 | Walker | 29.0 | Lower | 20.0% | 53 | 19.9% | 1.1*% | 4.9% |
| 38 | Limestone | 27.0 | Lower | 16.1% | 69 | 18.9% | 1.1*% | 3.3% |
| 39 | Lee | 26.2 | Lower | 17.1% | 65 | 23.4% | 0.5% | 3.5% |
| 40 | Elmore | 22.7 | Lower | 15.2% | 56 | 18.3% | 1.1*% | 4.6% |
| 41 | Autauga | 21.2 | Lower | 17.8% | 47 | 20.2% | 1.1*% | 2.4% |
| 42 | Shelby | 15.1 | Lower | 17.3% | 56 | 19.6% | 0.4% | 2.9% |
Twenty-five counties are not ranked because they fall below the 12,000-housing-unit floor: Barbour, Bibb, Bullock, Butler, Choctaw, Clarke, Clay, Cleburne, Conecuh, Coosa, Crenshaw, Fayette, Greene, Hale, Henry, Lamar, Lowndes, Macon, Marengo, Monroe, Perry, Pickens, Sumter, Washington, and Wilcox.
What we will watch
We plan to update this index quarterly, beginning with the first quarter of 2027. Three things will tell us where Alabama goes from here: whether the statewide delinquency rate keeps climbing after rising for two straight years; whether Mobile County, the one large metro county in the Elevated tier, moves further up or back toward the middle; and whether the rise in filings that pushed Alabama into the national top ten in August holds through the end of 2026.
Sources and data
- Foreclosure activity and trend. ATTOM Data Solutions, 2026 Mid-Year U.S. Foreclosure Market Report and U.S. Foreclosure Rates by State, August 2026 (published September 18, 2026). Used for statewide filing counts, national ranks, the one-year and two-year changes, and the counties with the worst August filing rates.
- Historical rate and timelines. RealtyTrac, 2009 Year-End Foreclosure Market Report (via the Financial Crisis Inquiry Commission archive), and the RealtyTrac and ATTOM year-end reports for 2012, 2013, and 2016. Used for Alabama’s 2009 rate and rank and its fourth-quarter foreclosure timelines.
- Housing market softness. Realtor.com Economic Research, county inventory core metrics through September 2026.
- Housing, mortgage status, cost burden, seasonal homes, and unemployment. U.S. Census Bureau, American Community Survey five-year estimates, 2020 to 2024.
- Current unemployment. U.S. Bureau of Labor Statistics, Local Area Unemployment Statistics, the 12 published months from August 2025 through August 2026 (BLS published no October 2025 figures). Used only for the sensitivity test.
- Mortgage delinquency. CFPB Mortgage Performance Trends, state and county data through December 2025. Used for the 90-or-more day delinquency rates and the national and state comparisons.
- Foreclosure process. Code of Alabama sections 35-10-13, 6-5-248, 6-5-251, and 6-5-252, and Nolo. Help resources from HUD, Legal Services Alabama, the Alabama State Bar, the State Banking Department, and Mortgage Assistance Alabama.
About NestCash
NestCash buys houses for cash in twelve states and publishes original housing and distressed-property research across U.S. markets. Our original housing research helps homeowners, buyers, and investors understand local market conditions. This report may be cited and its charts embedded with attribution to NestCash.

John is the Founder of NestCash and a leading voice in real estate investing and housing market strategy. With experience across 12 states, he helps buyers, sellers, and investors make smarter decisions using real-world insight and market data.